
Net-Zero Pathways
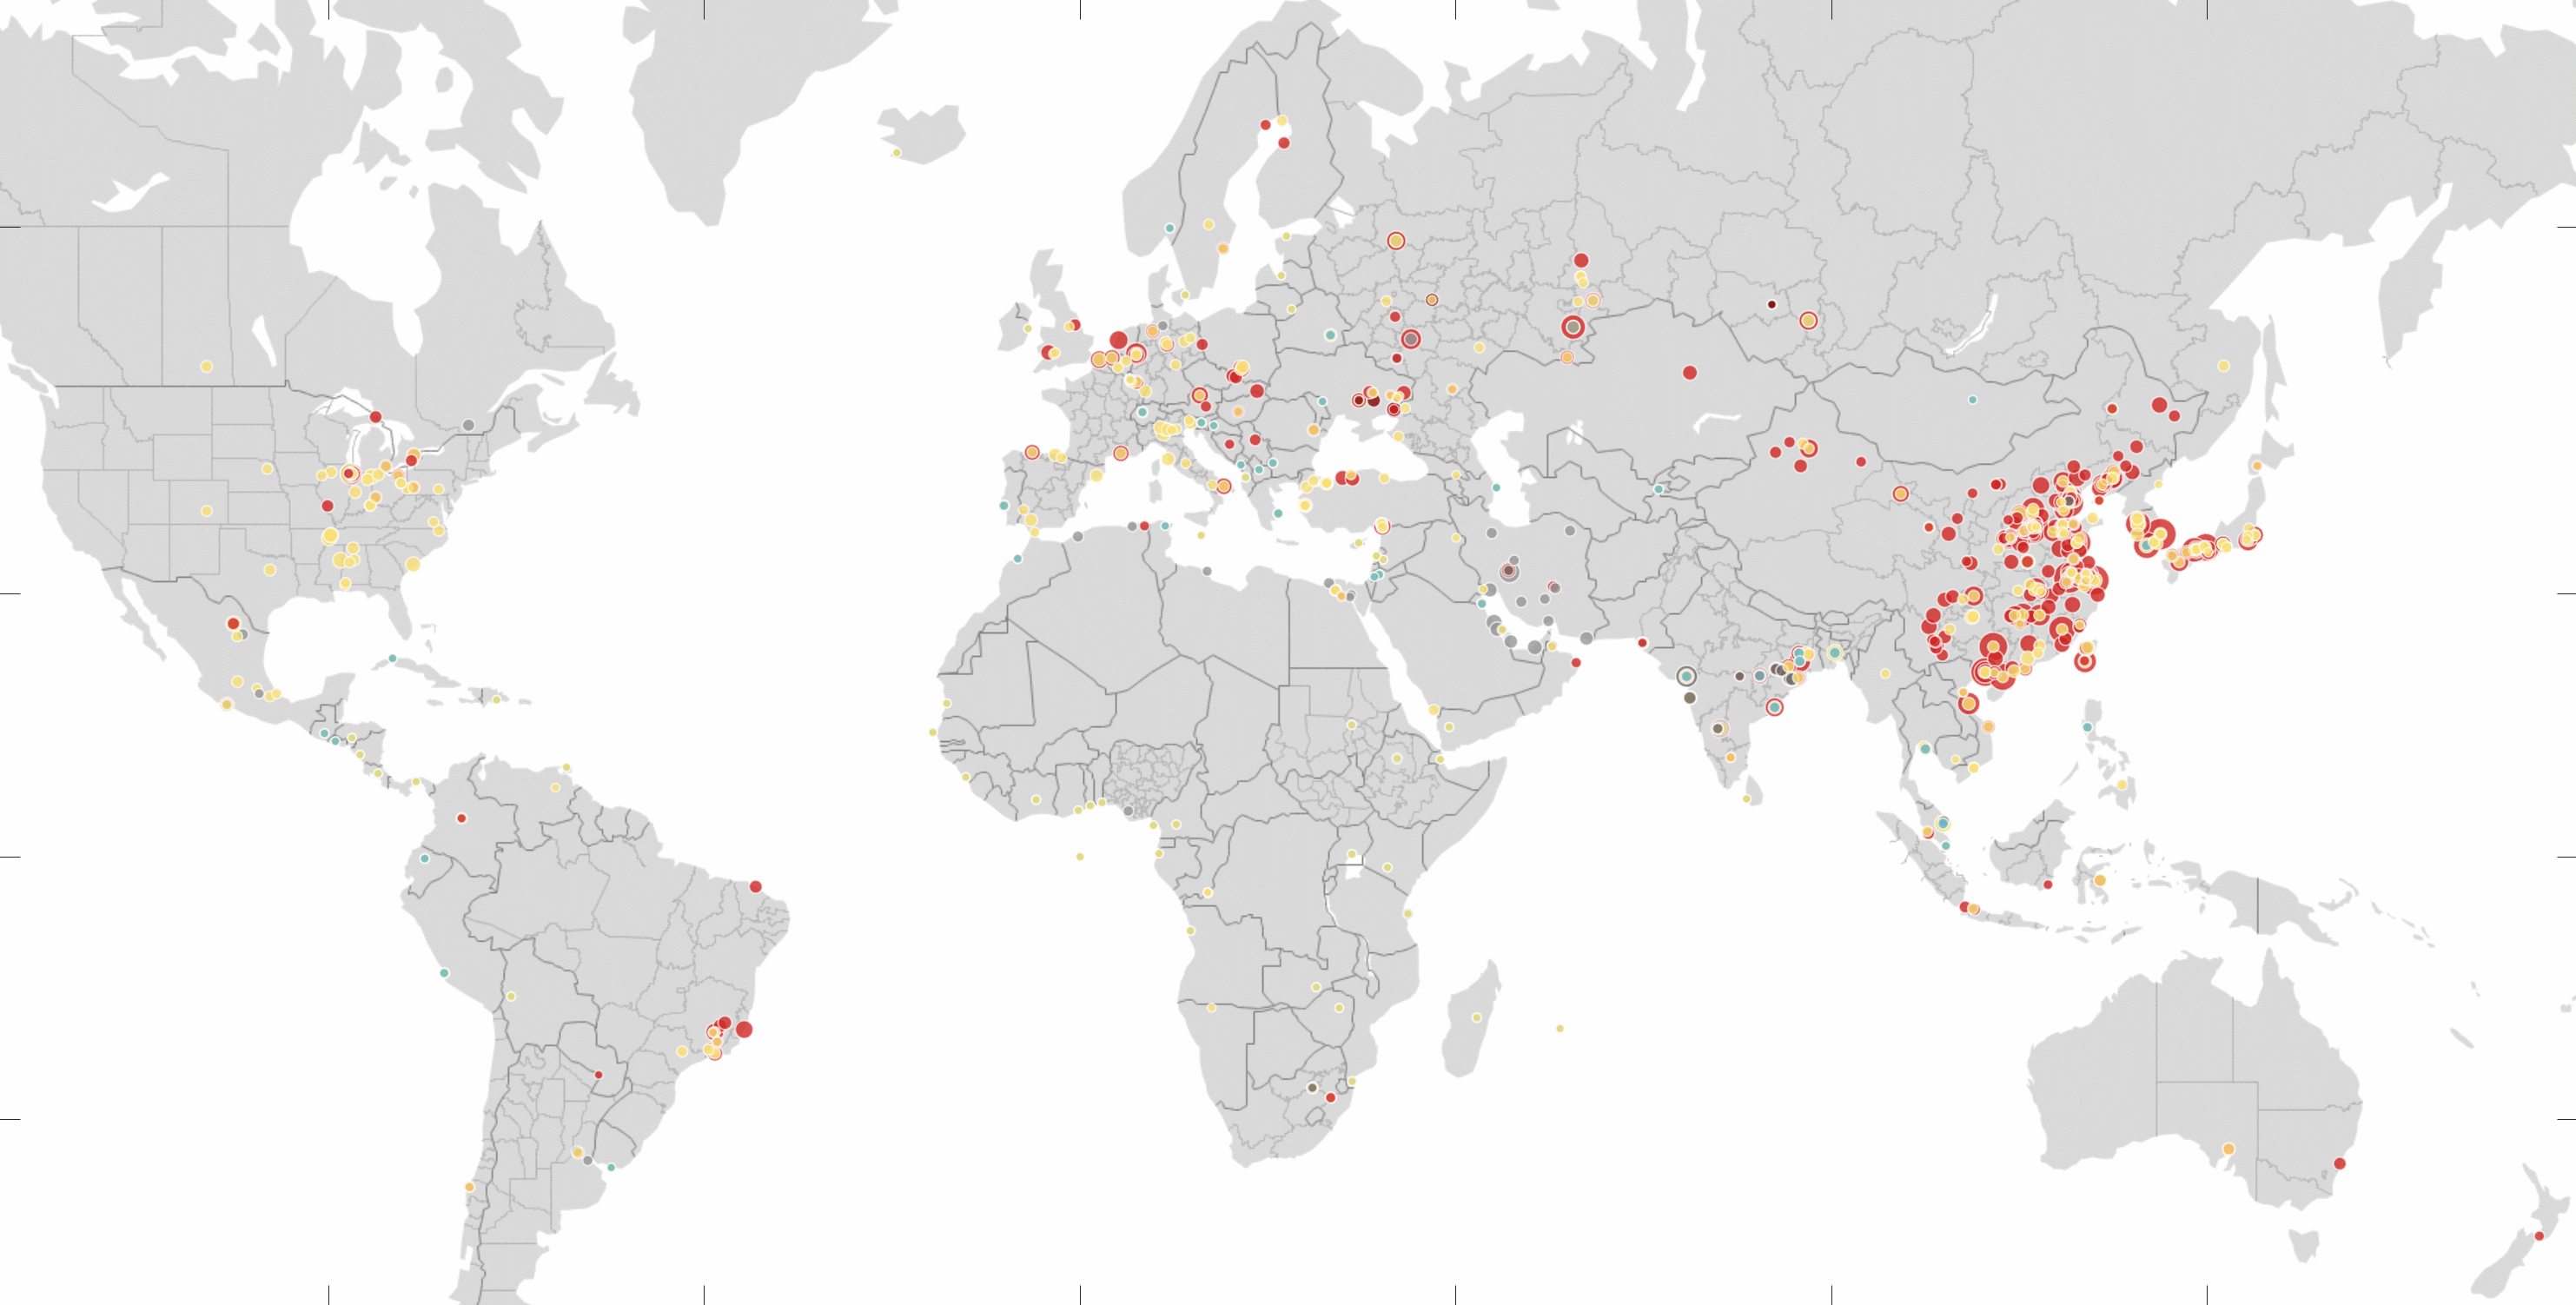
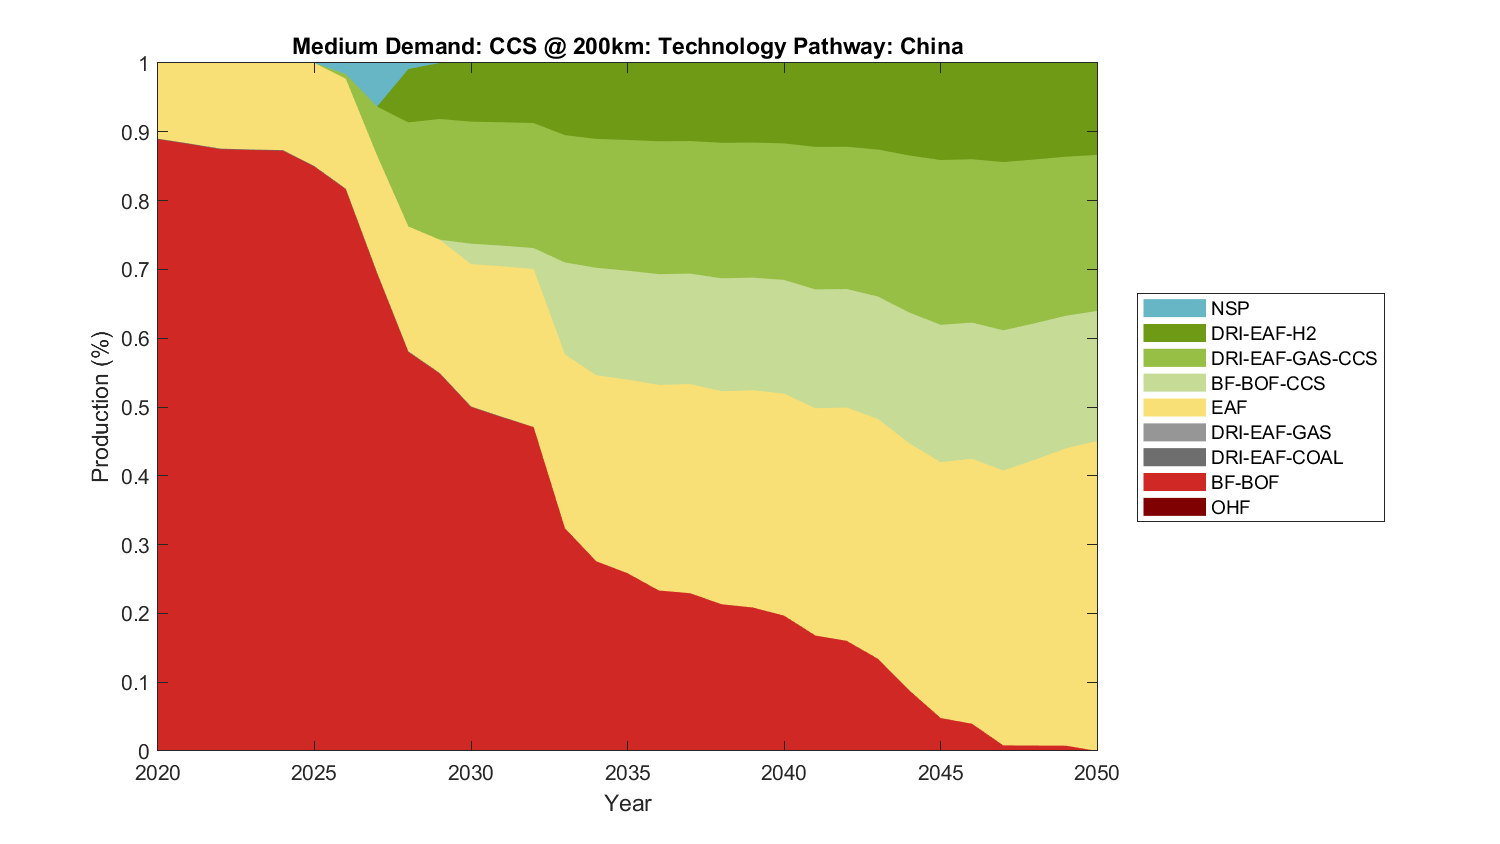
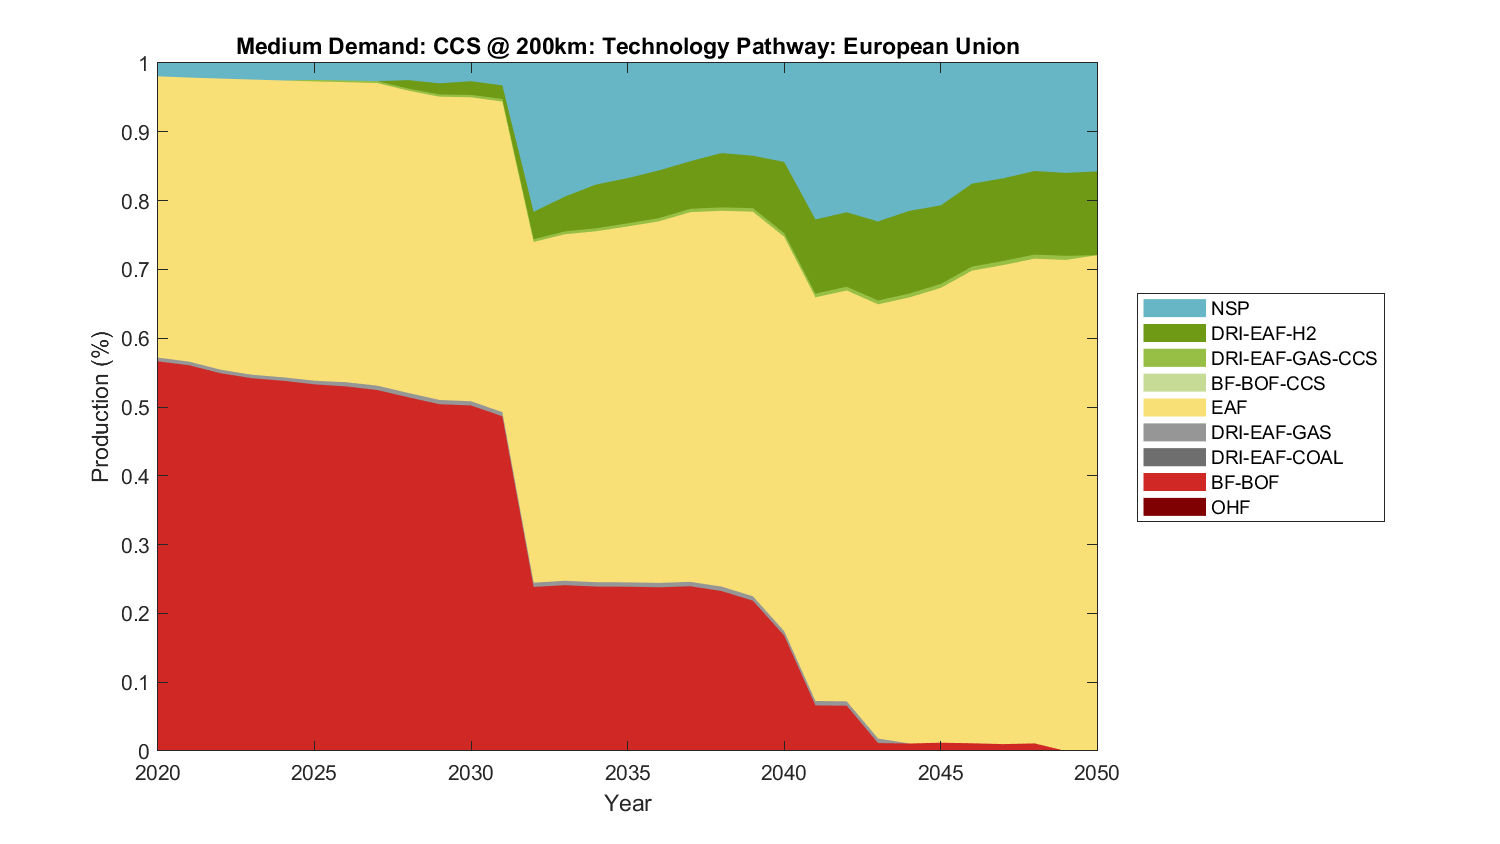
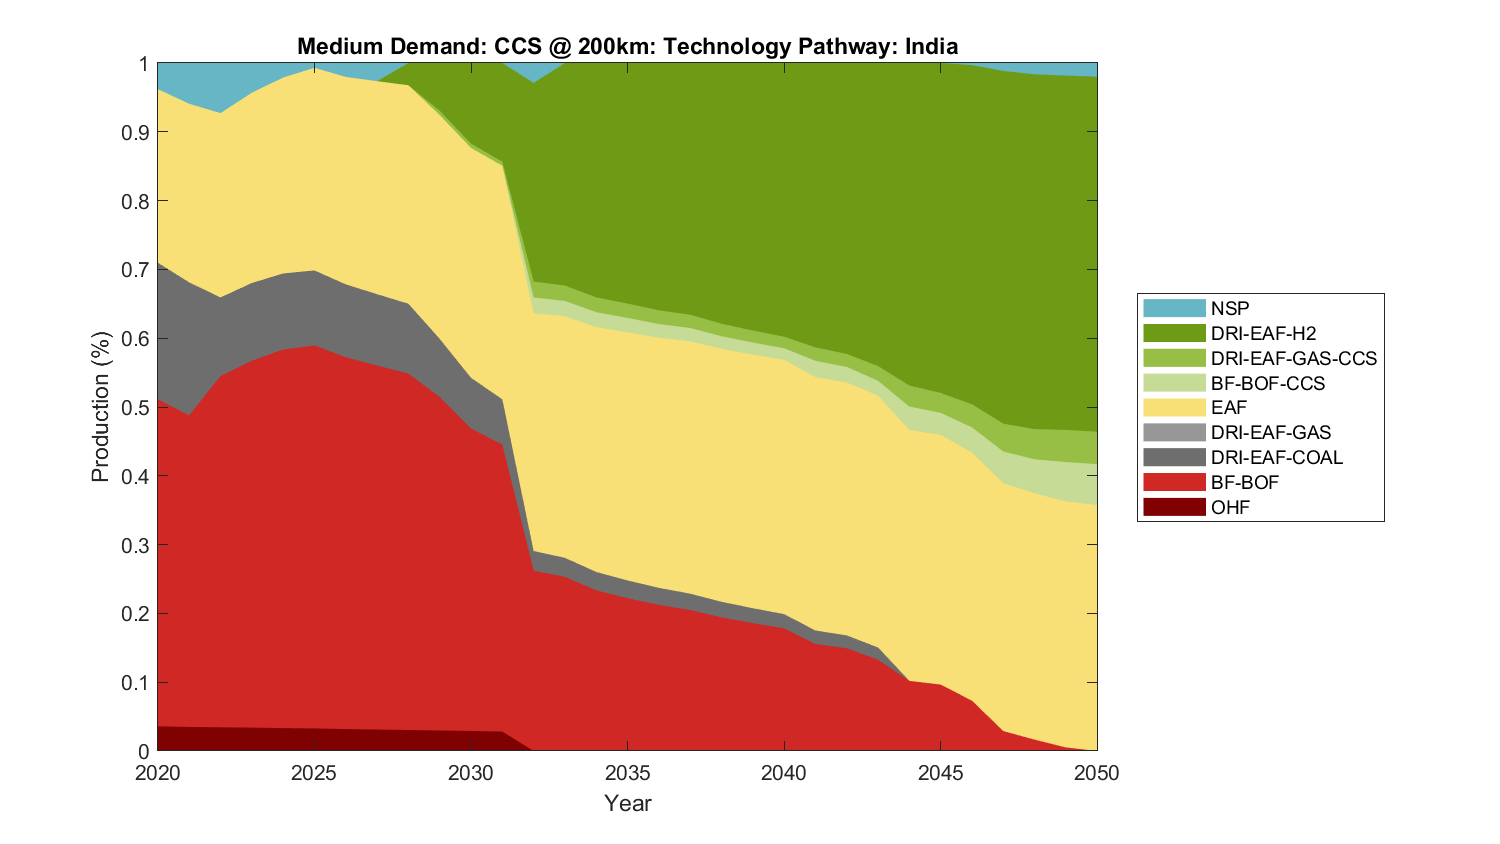
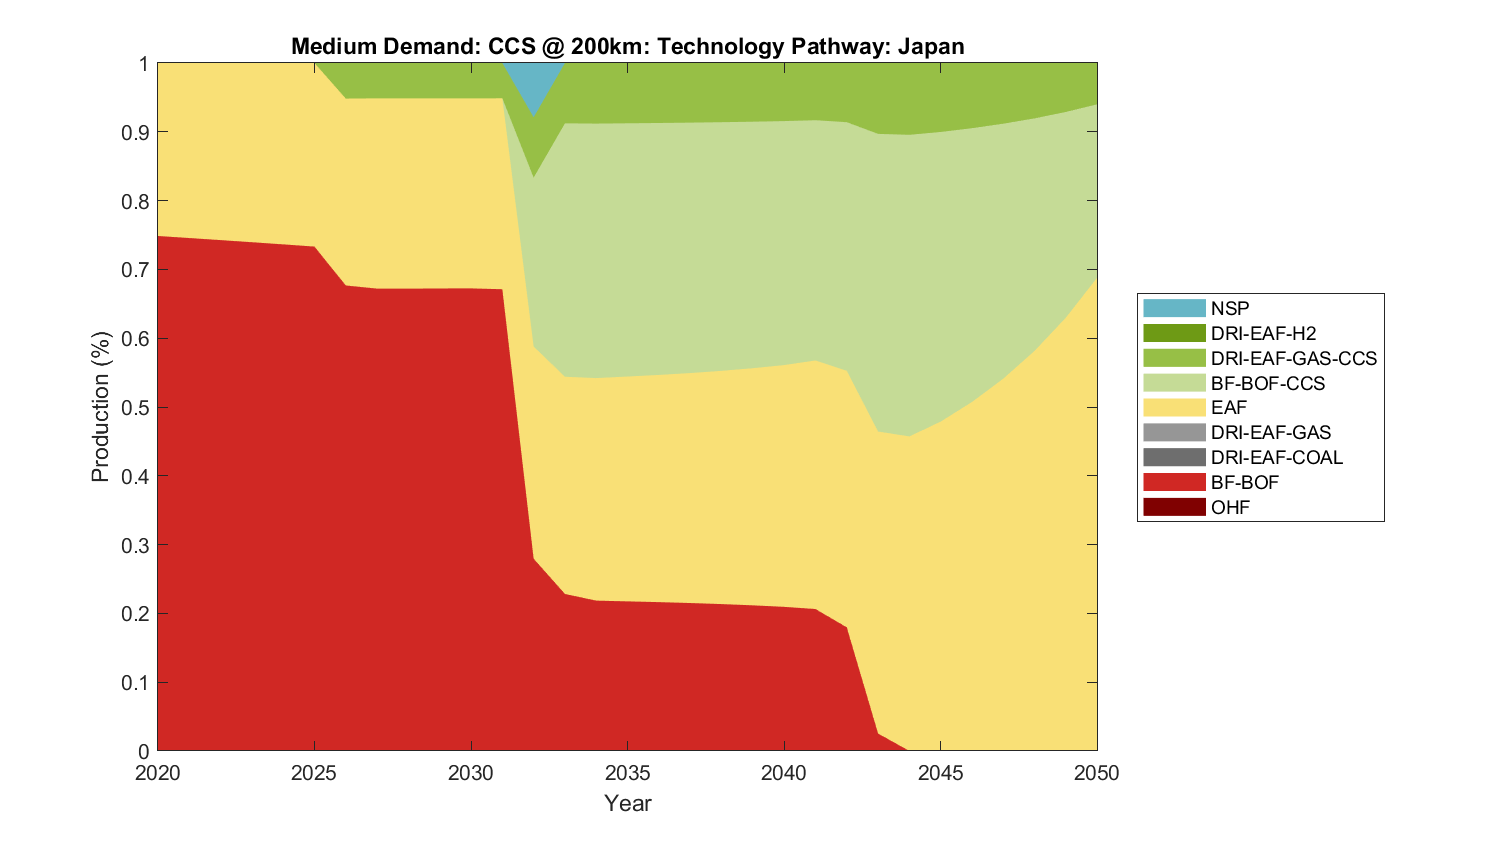
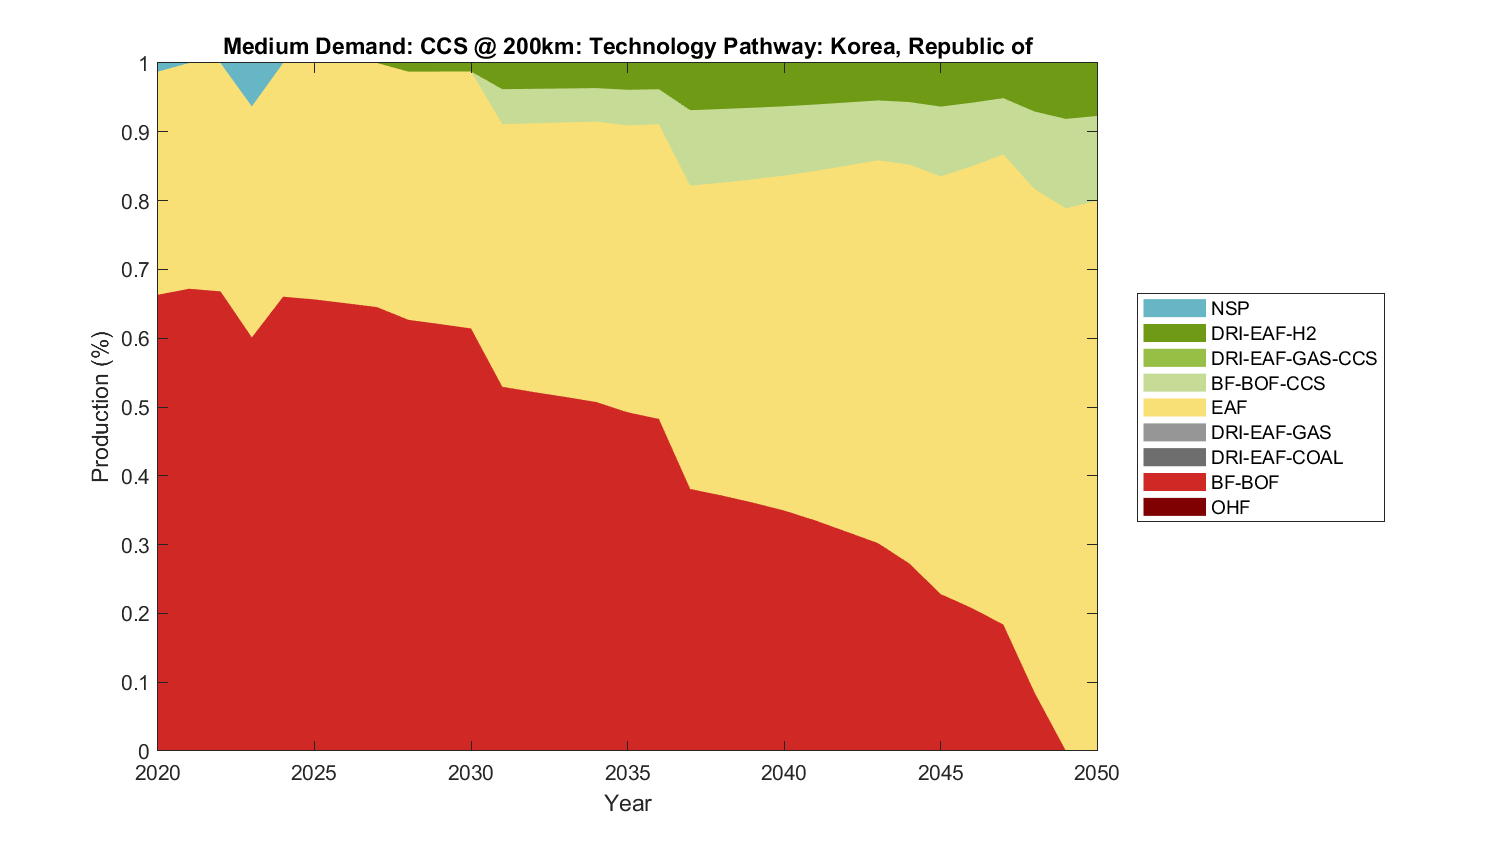
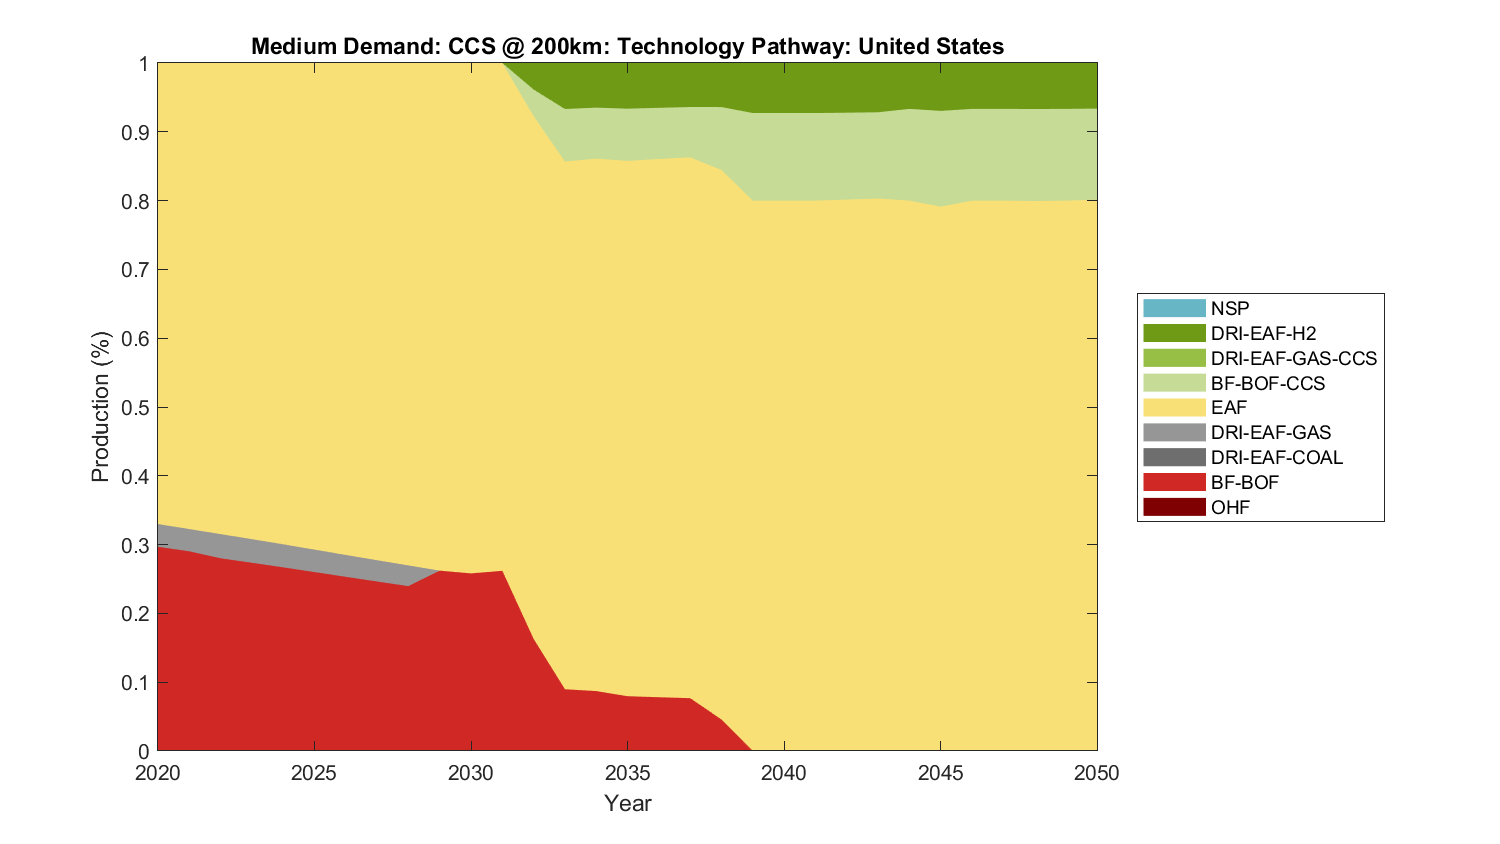
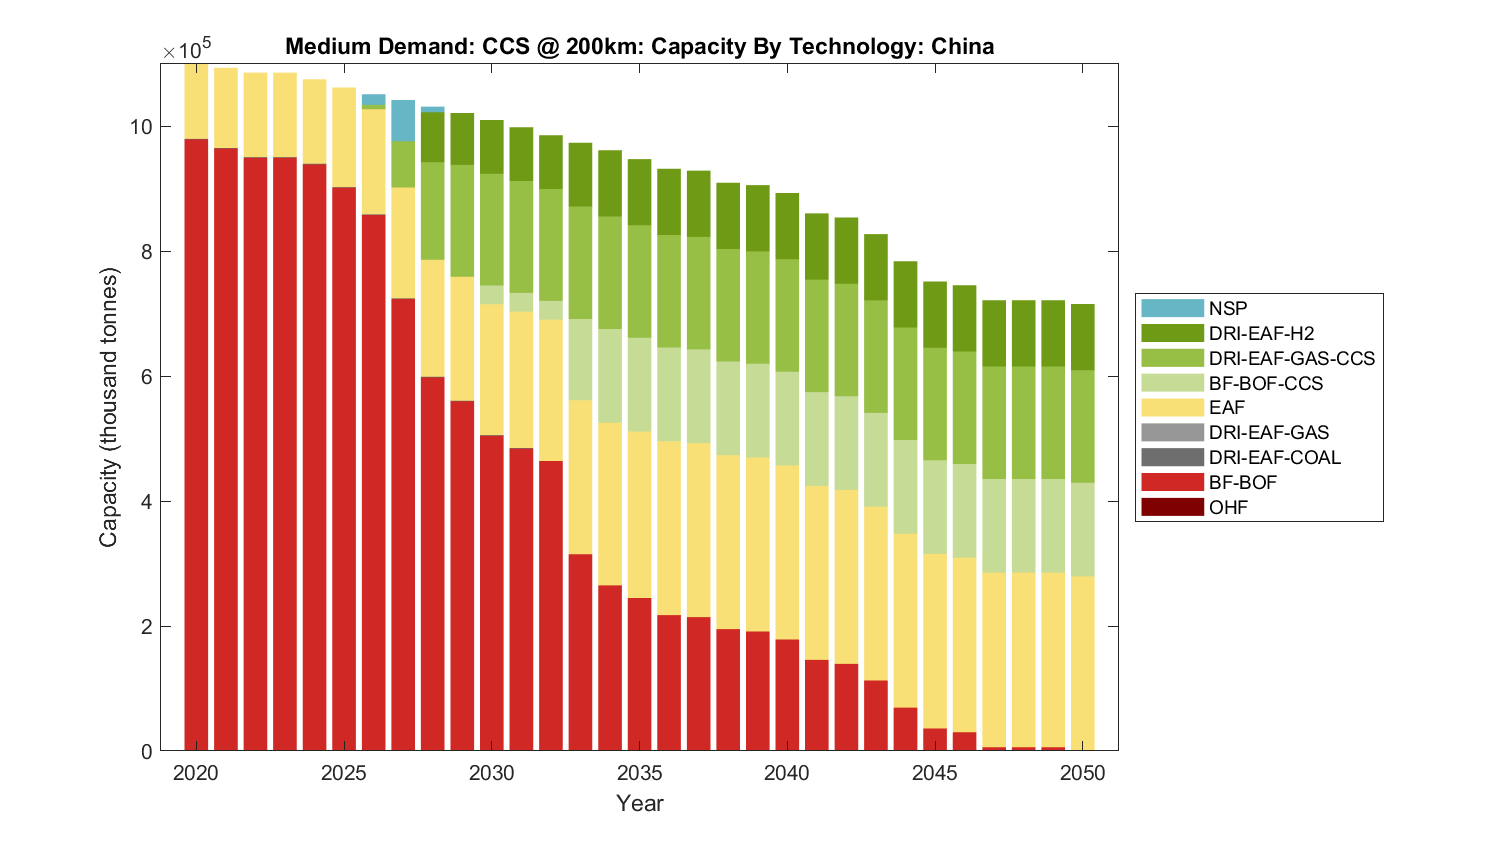
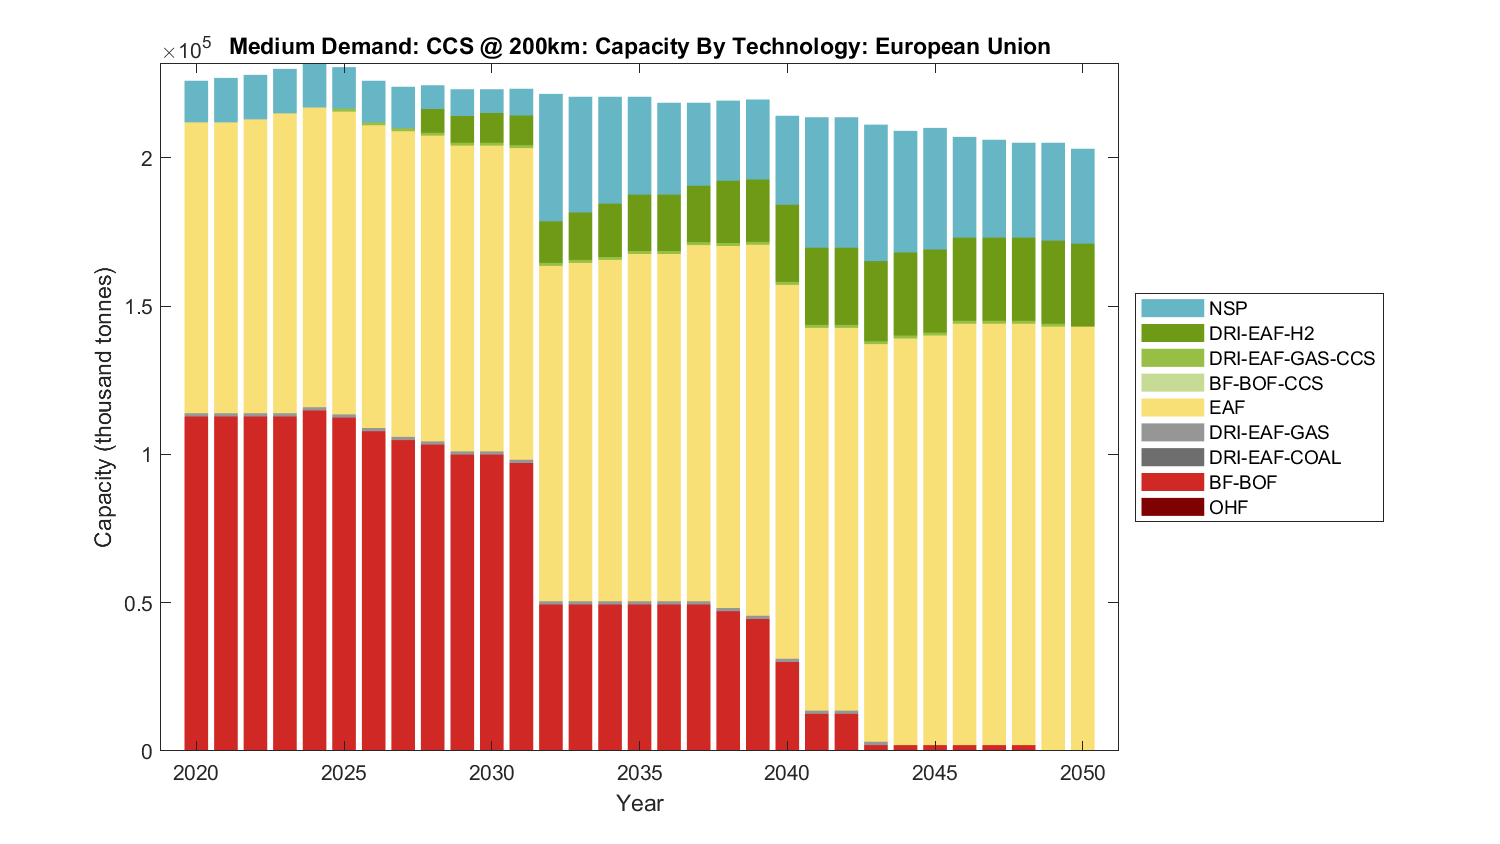
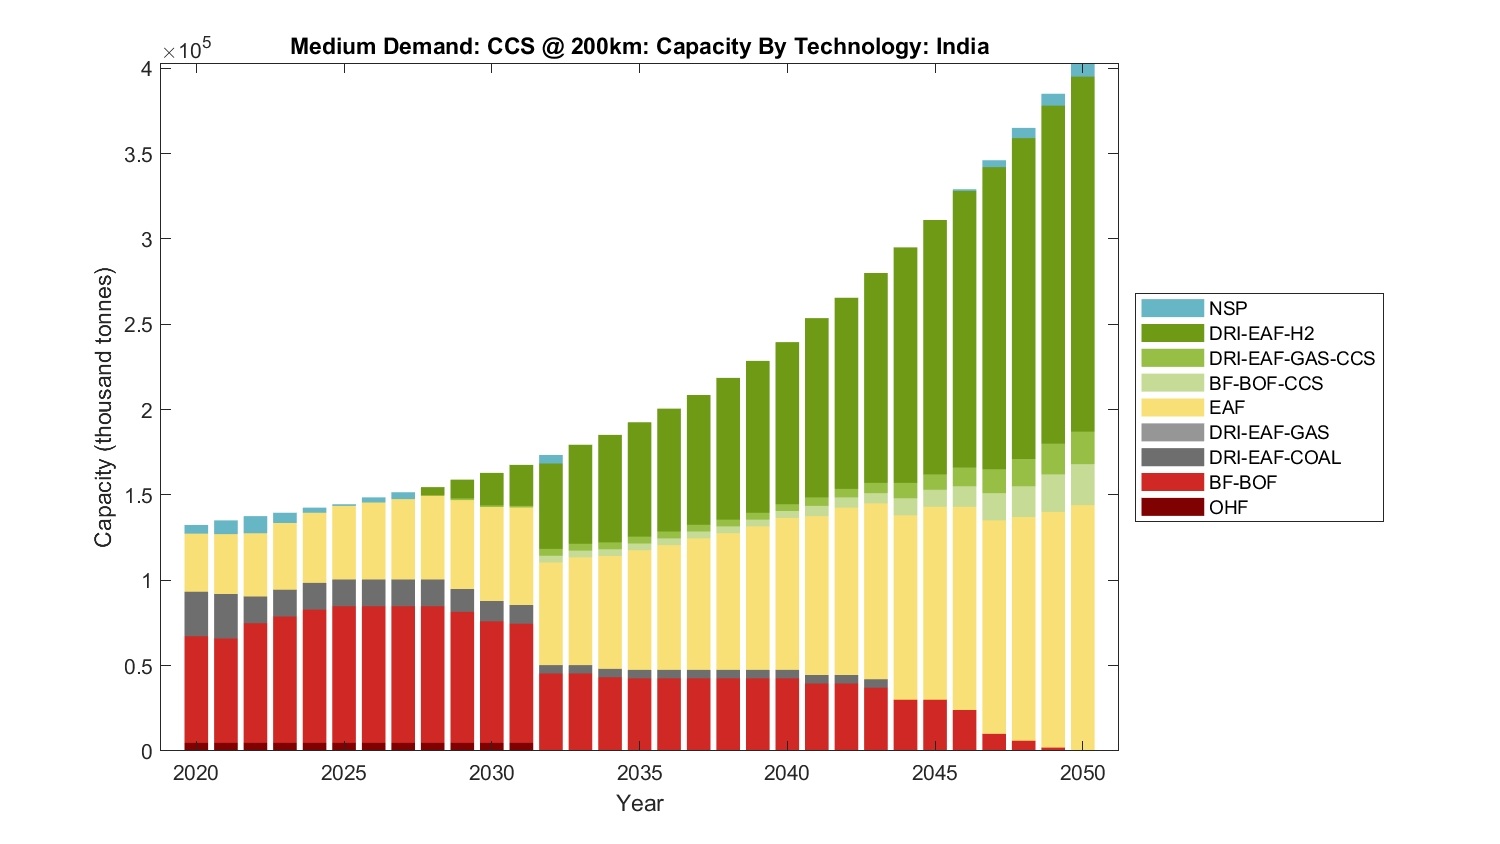
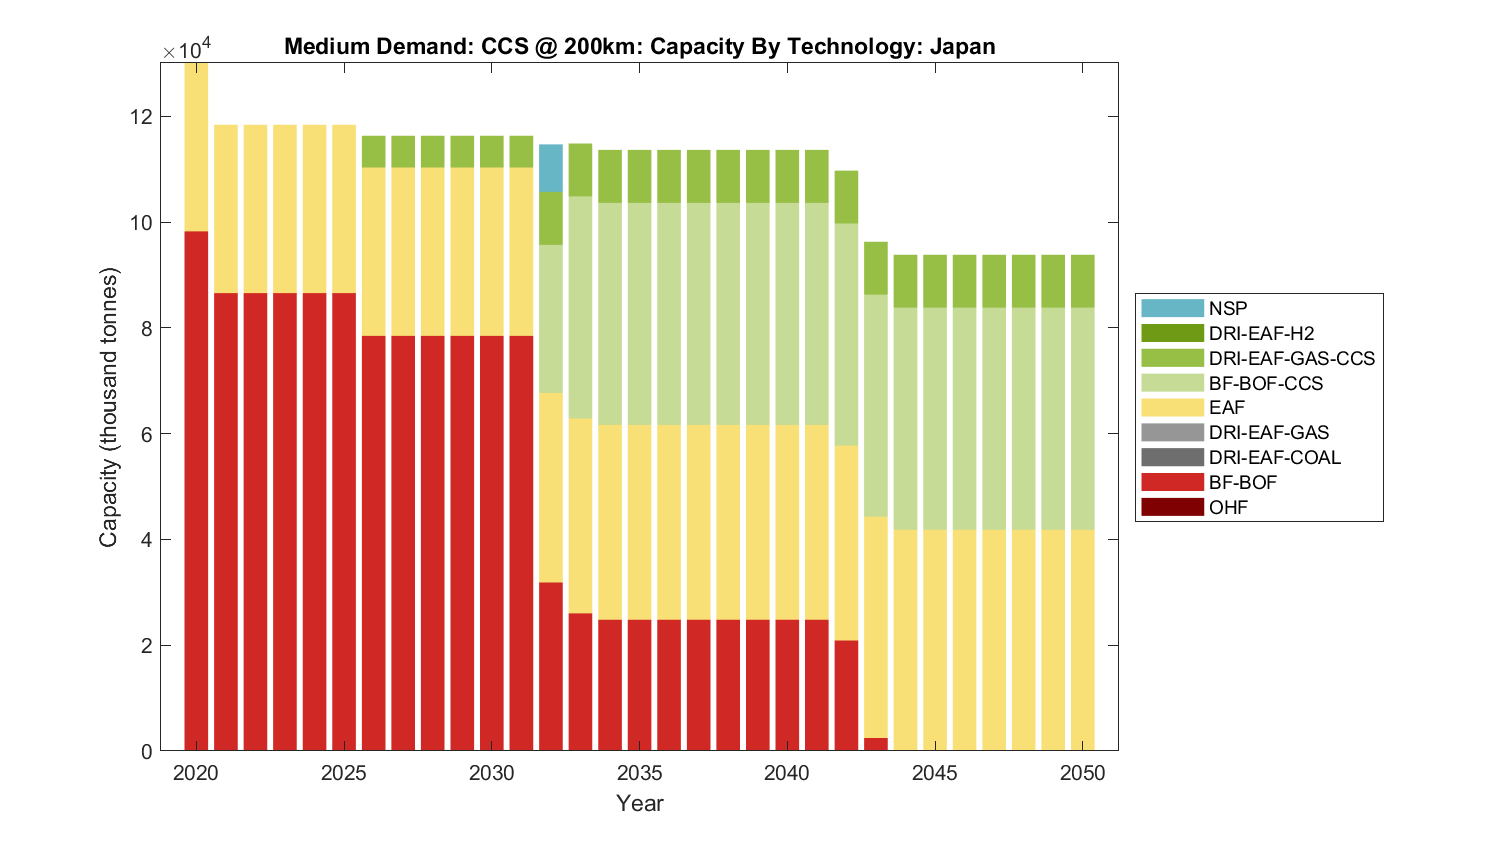
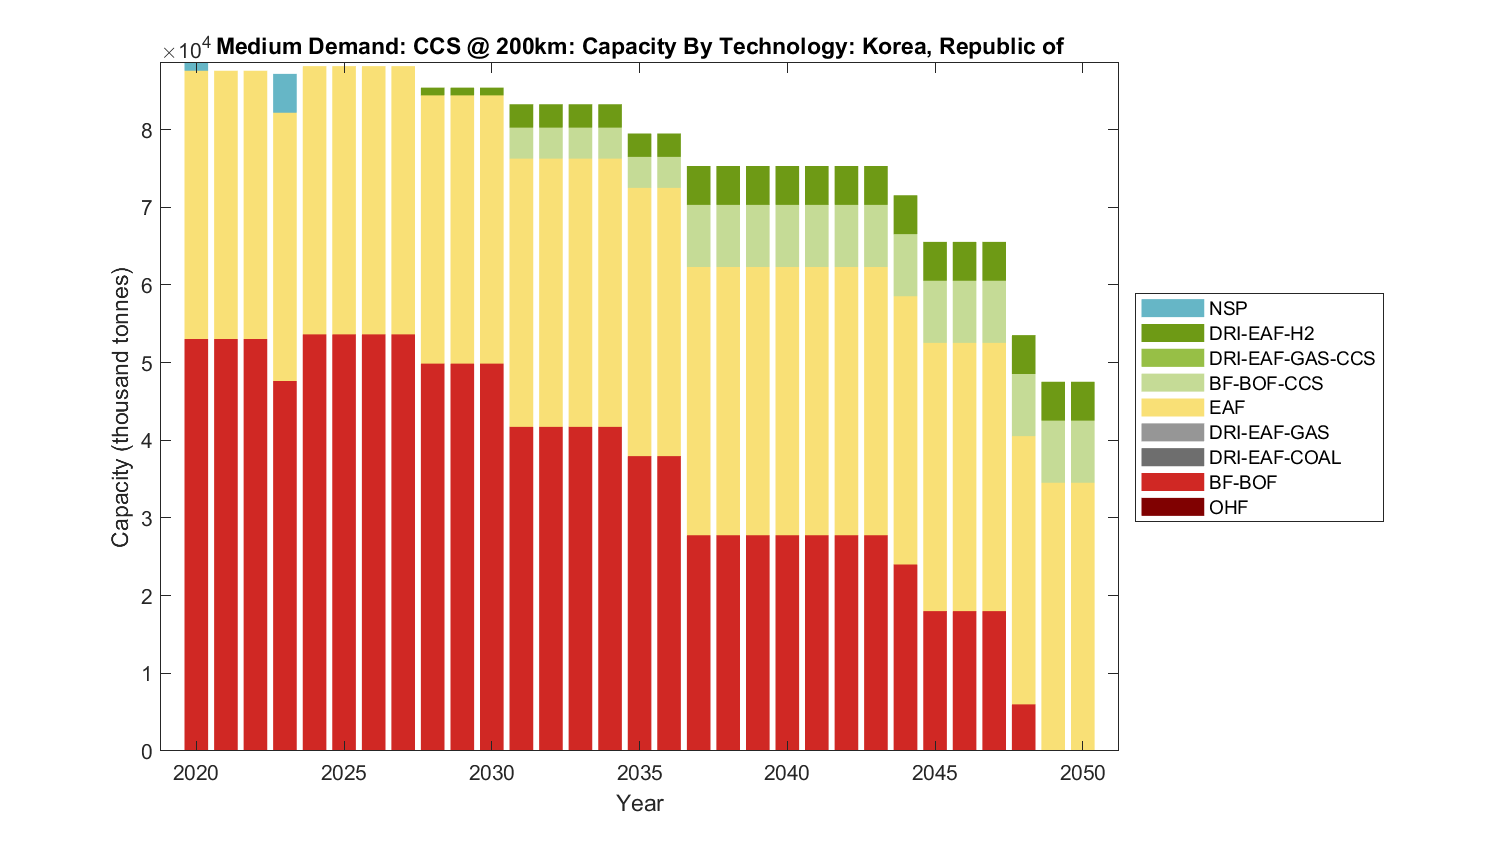
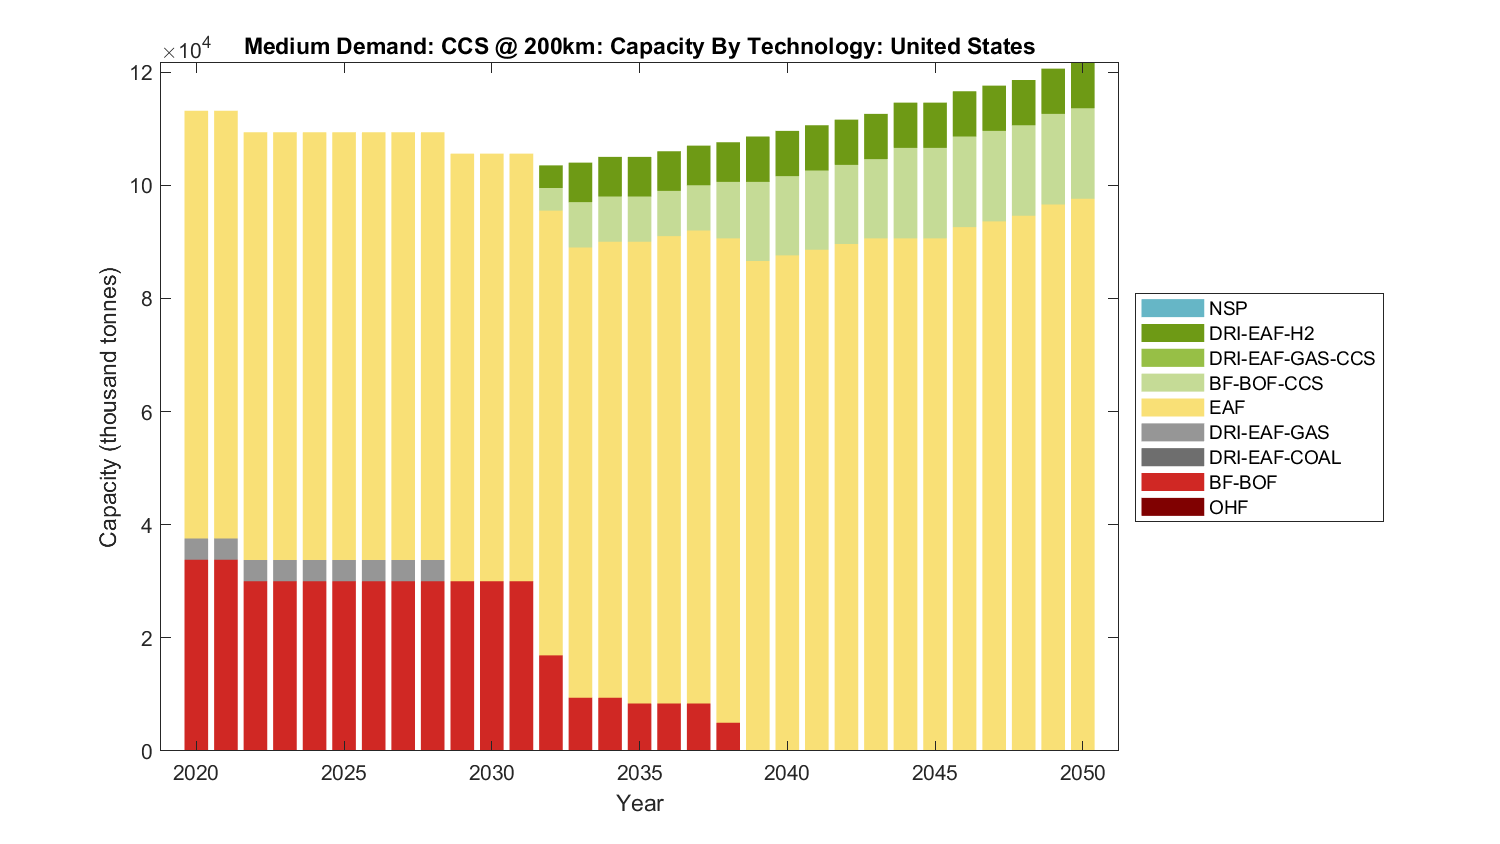
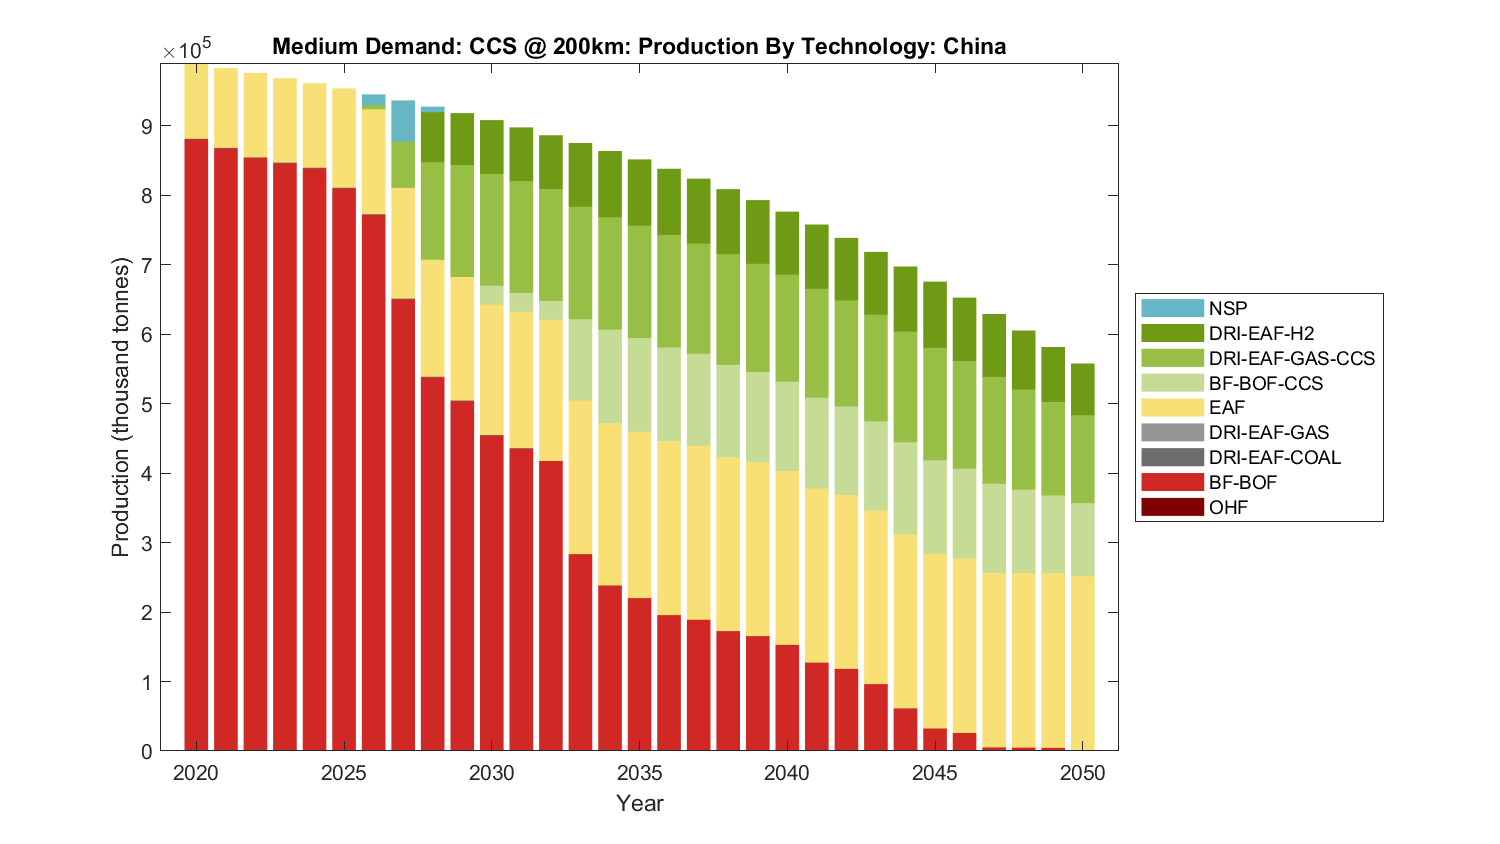
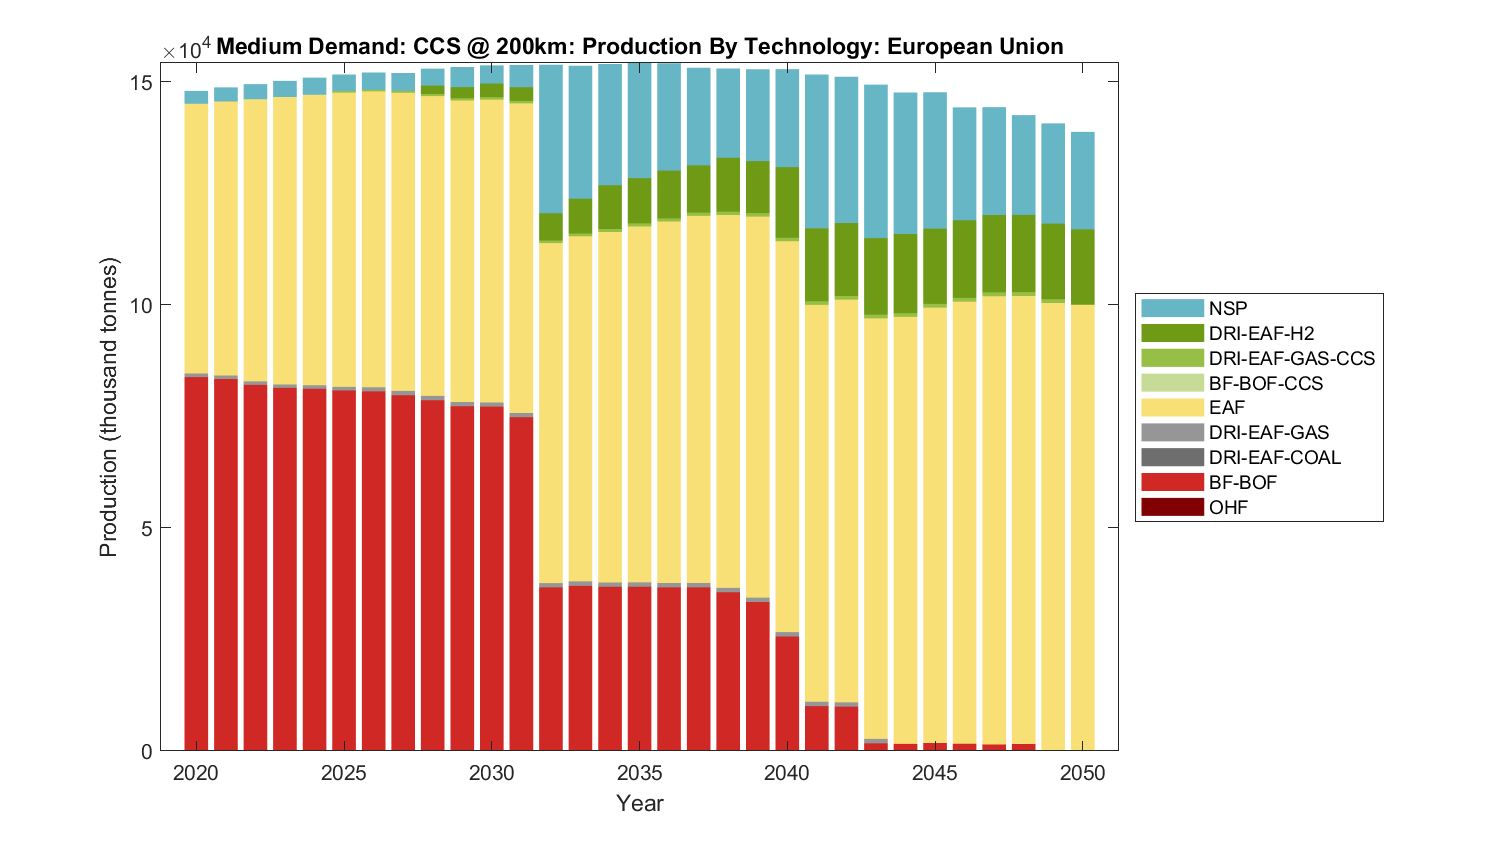
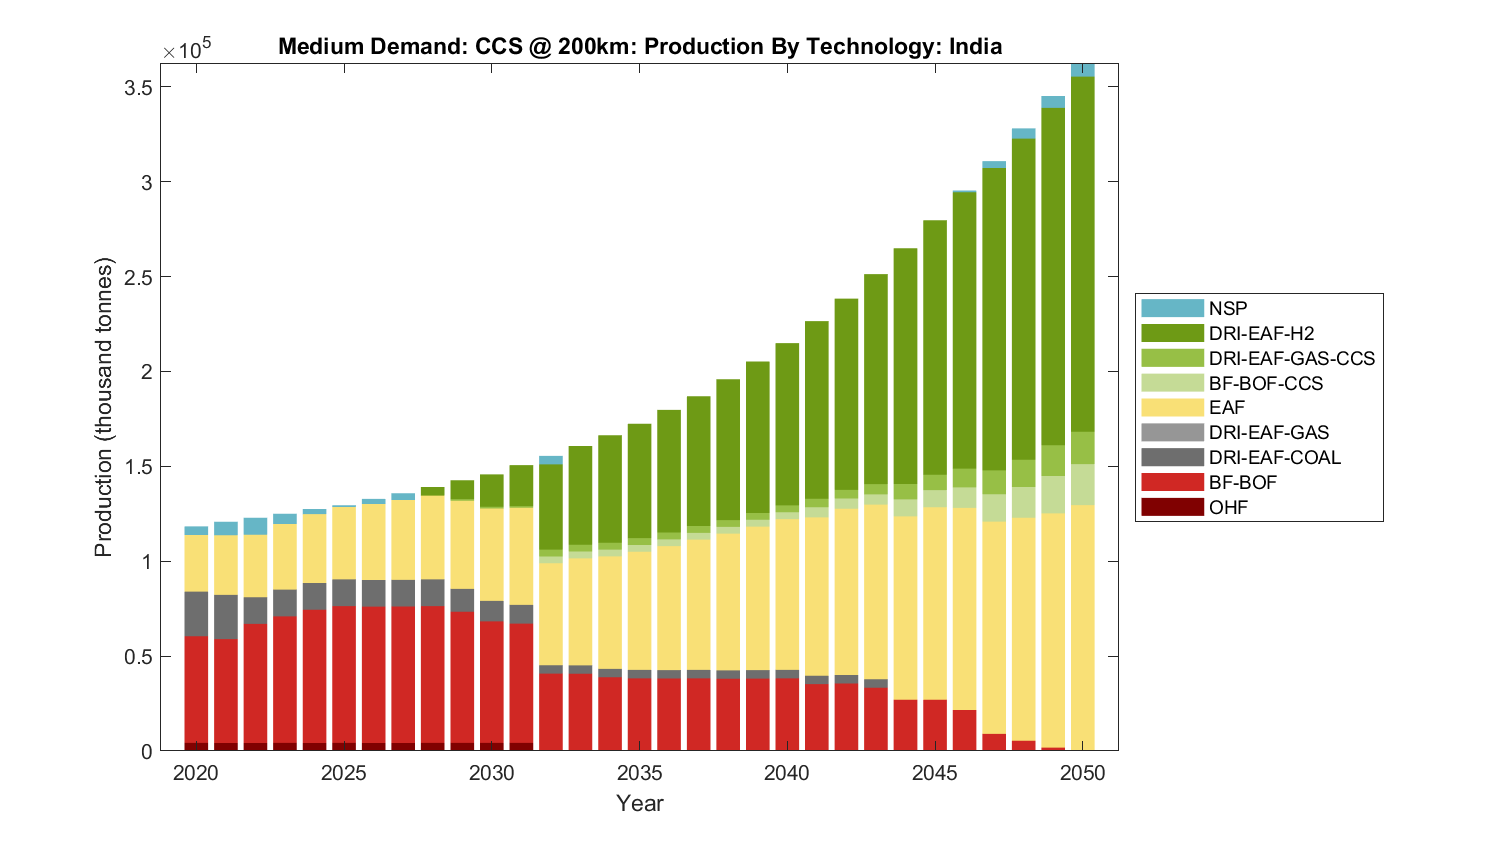
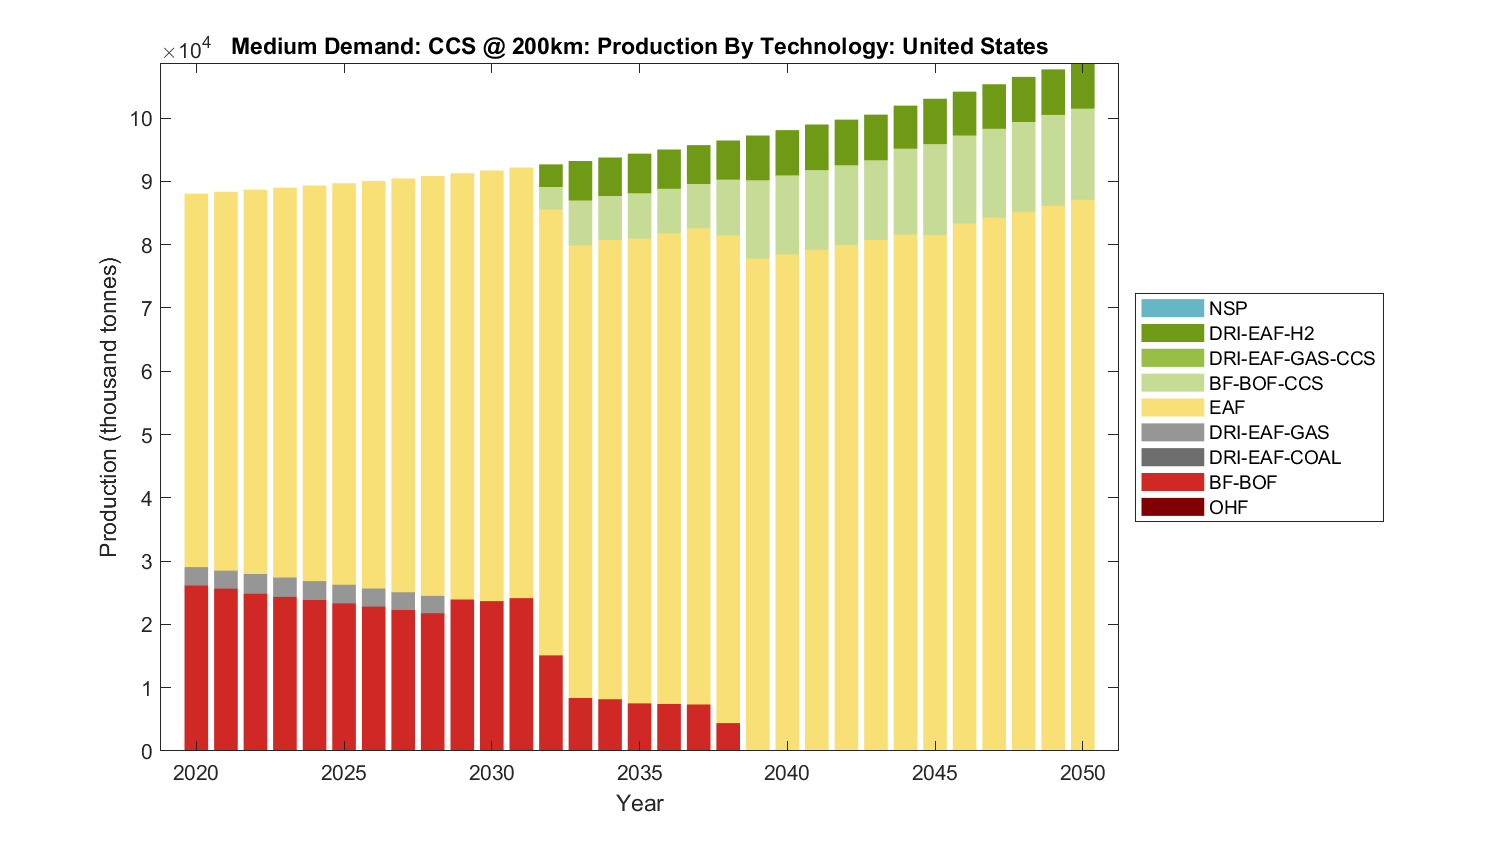
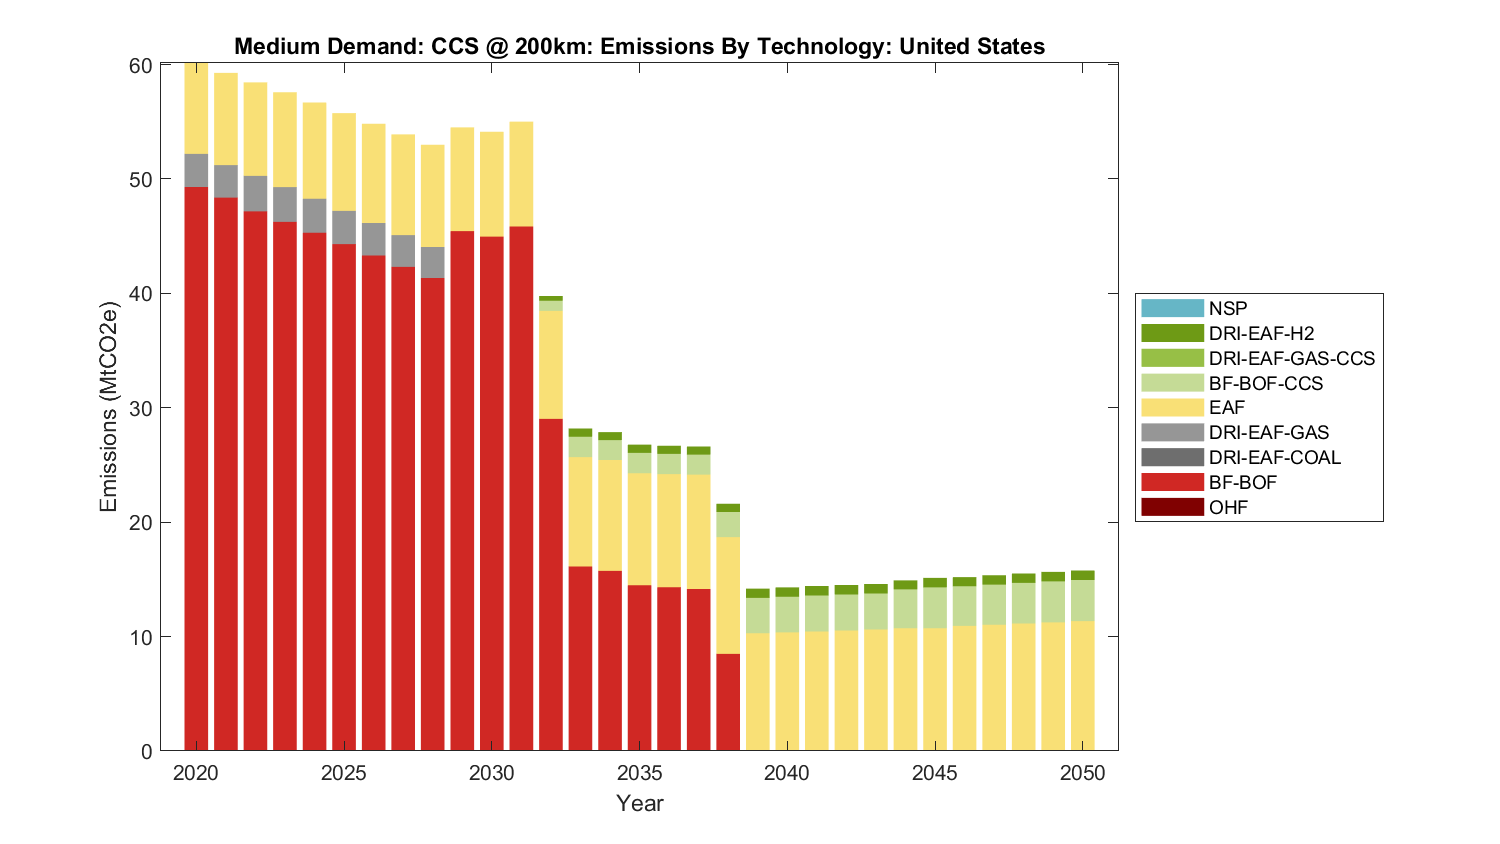
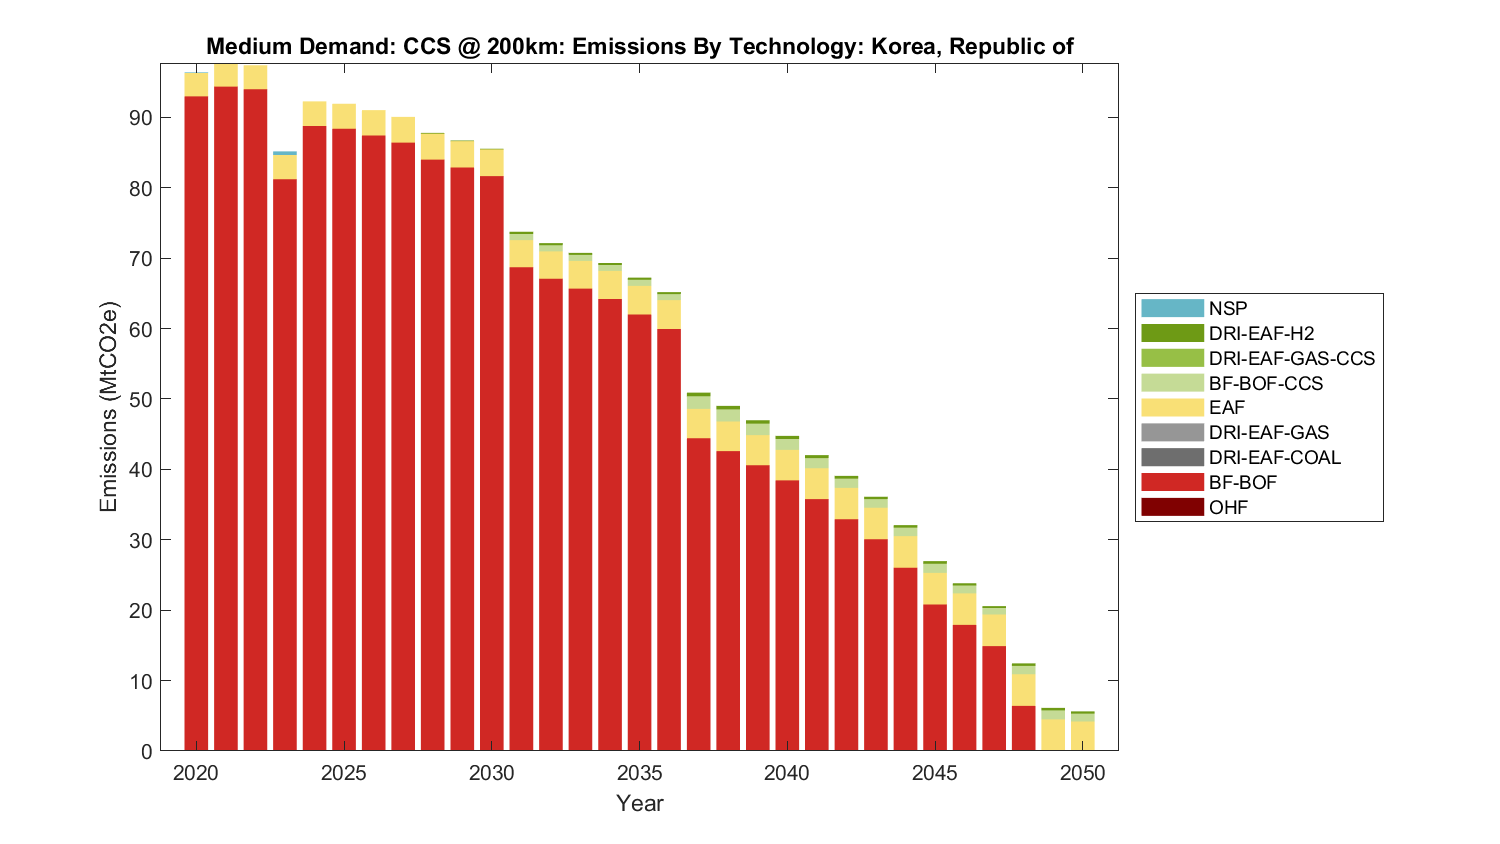
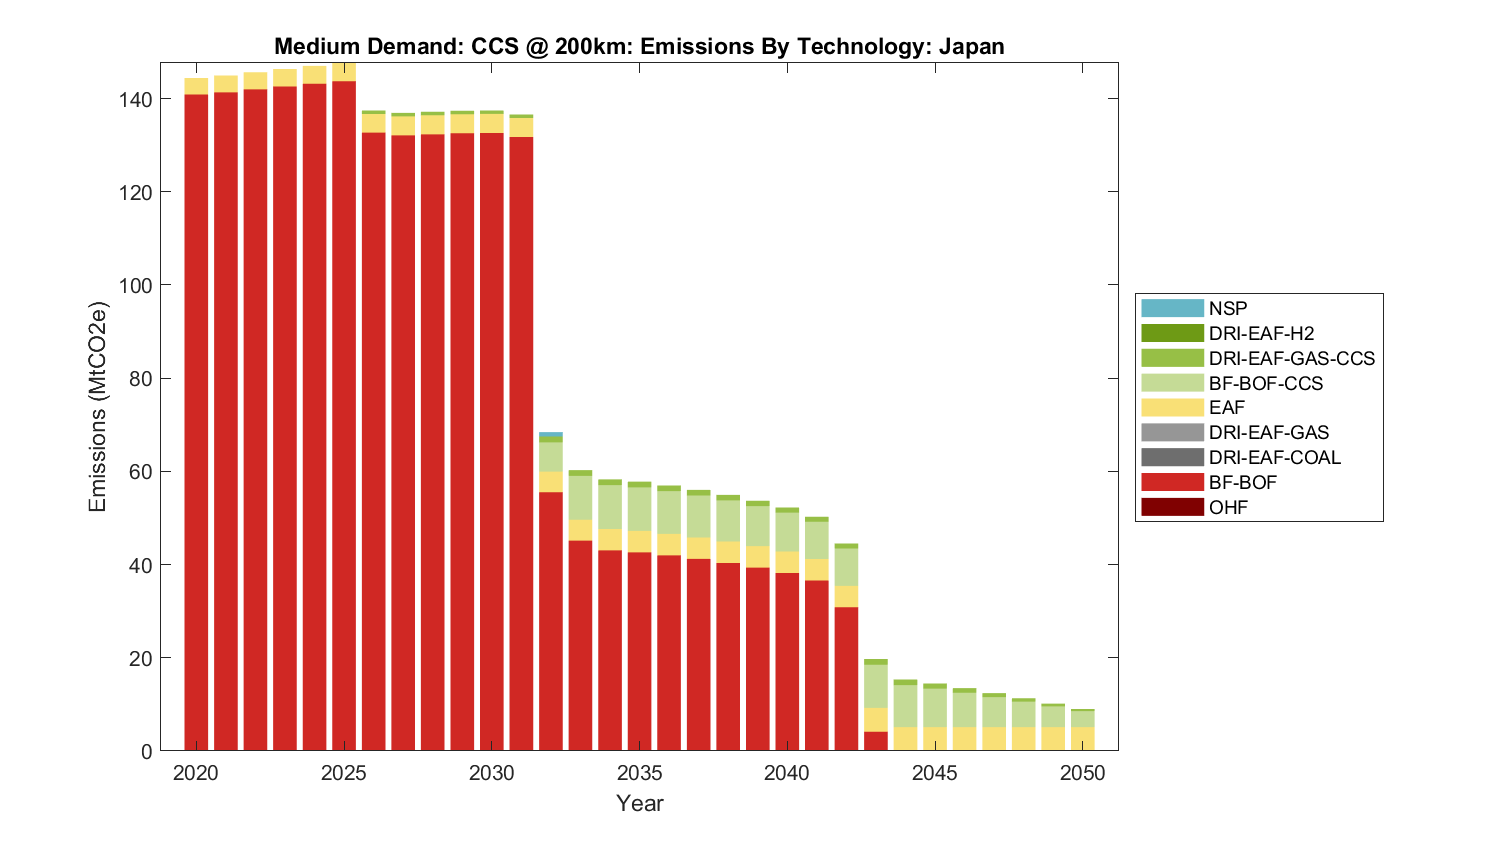
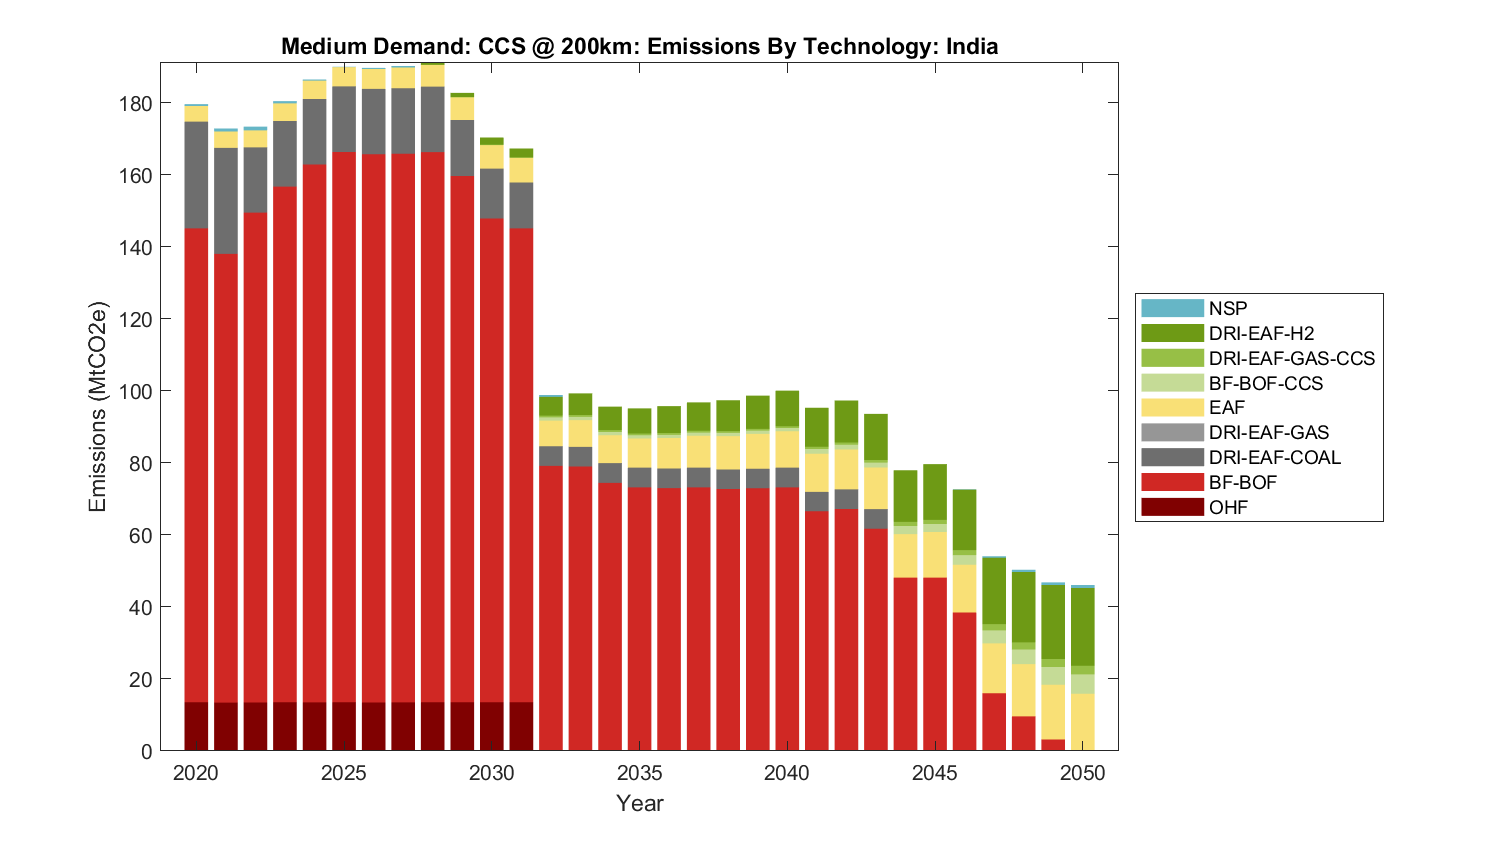
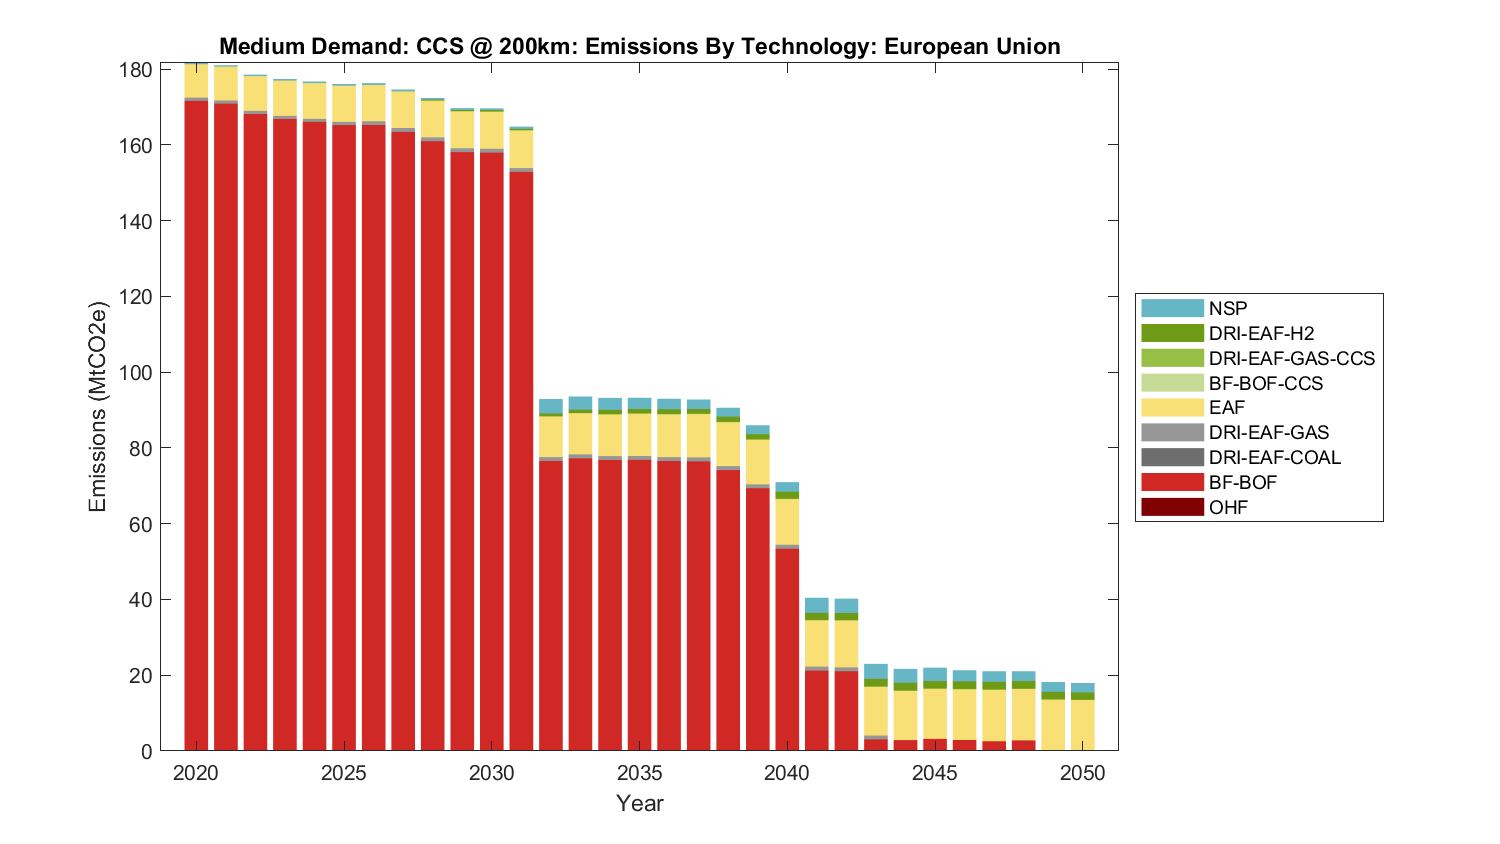
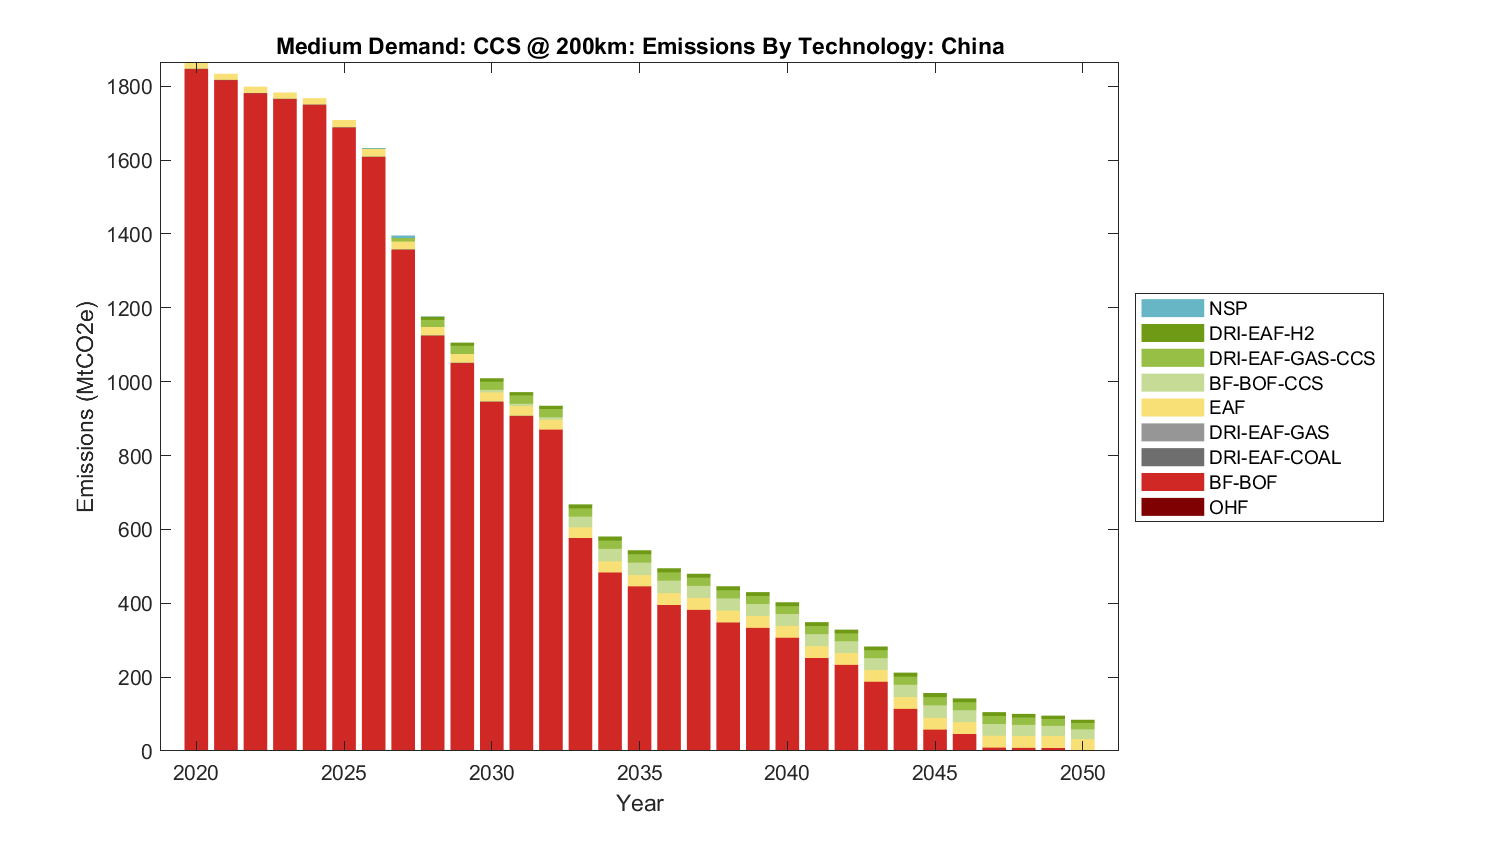
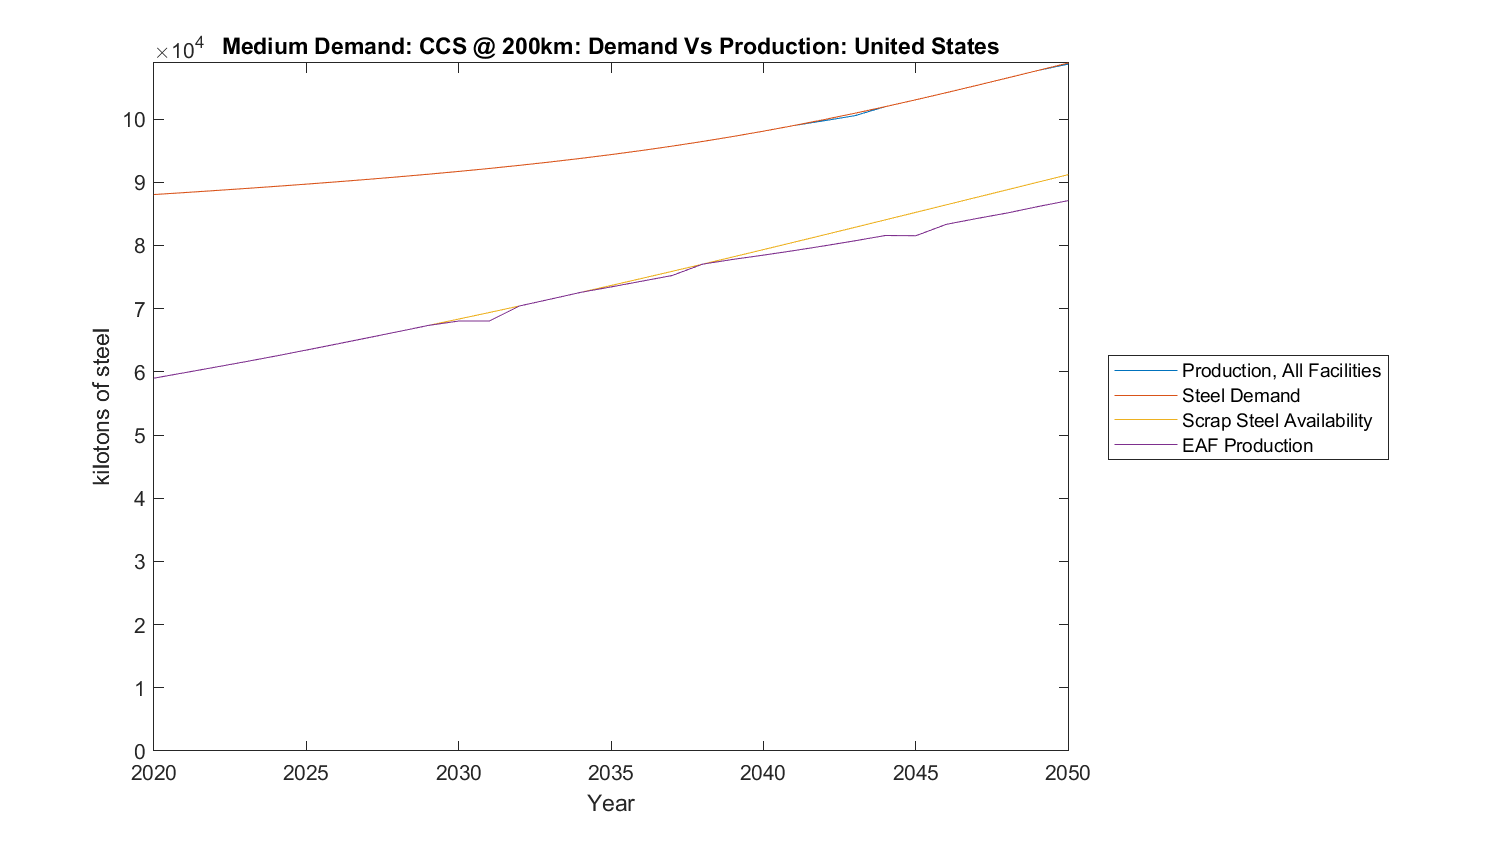
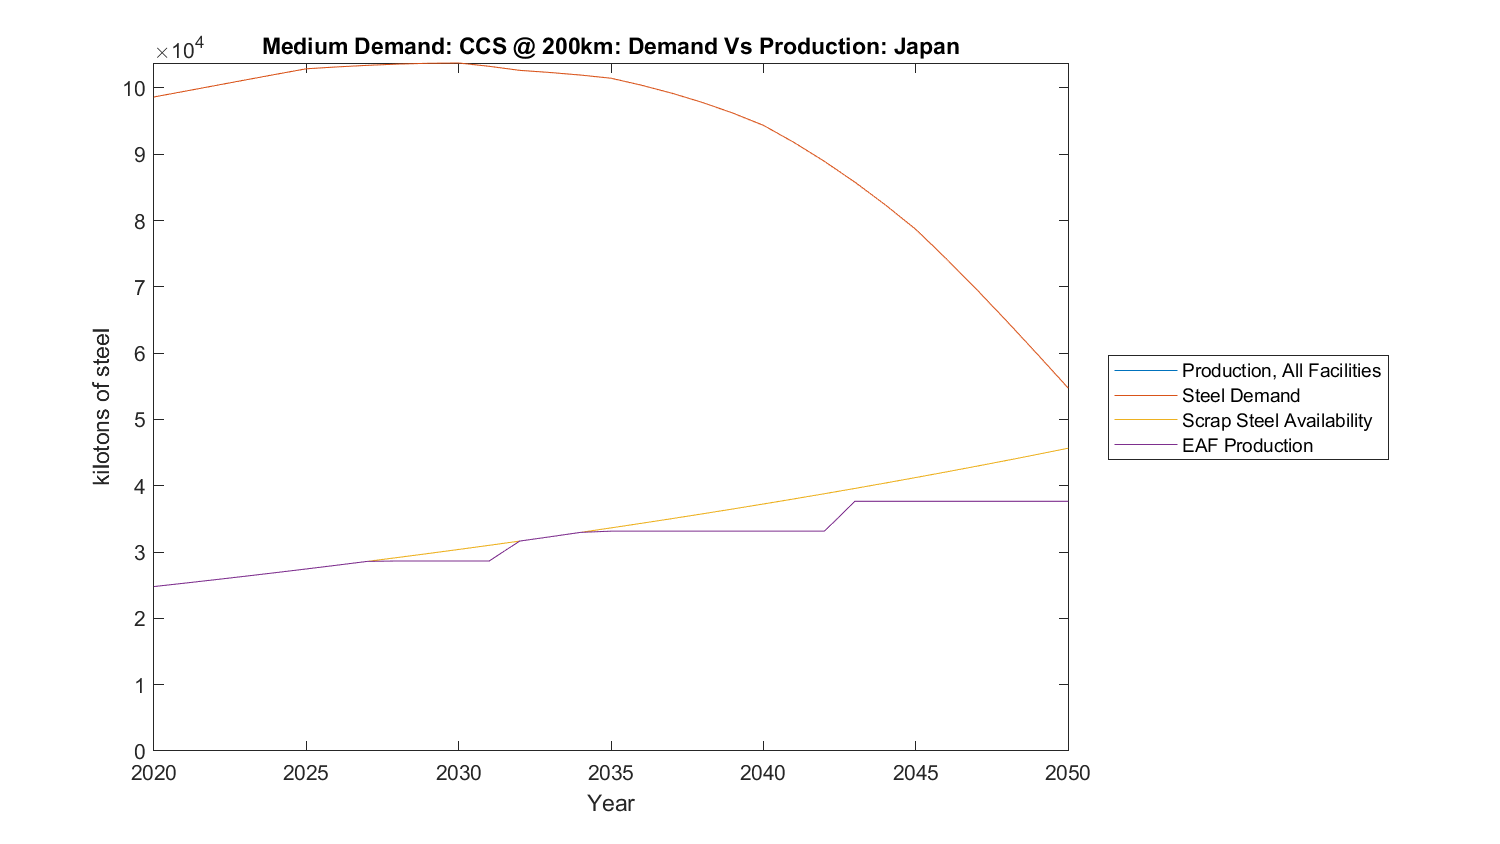
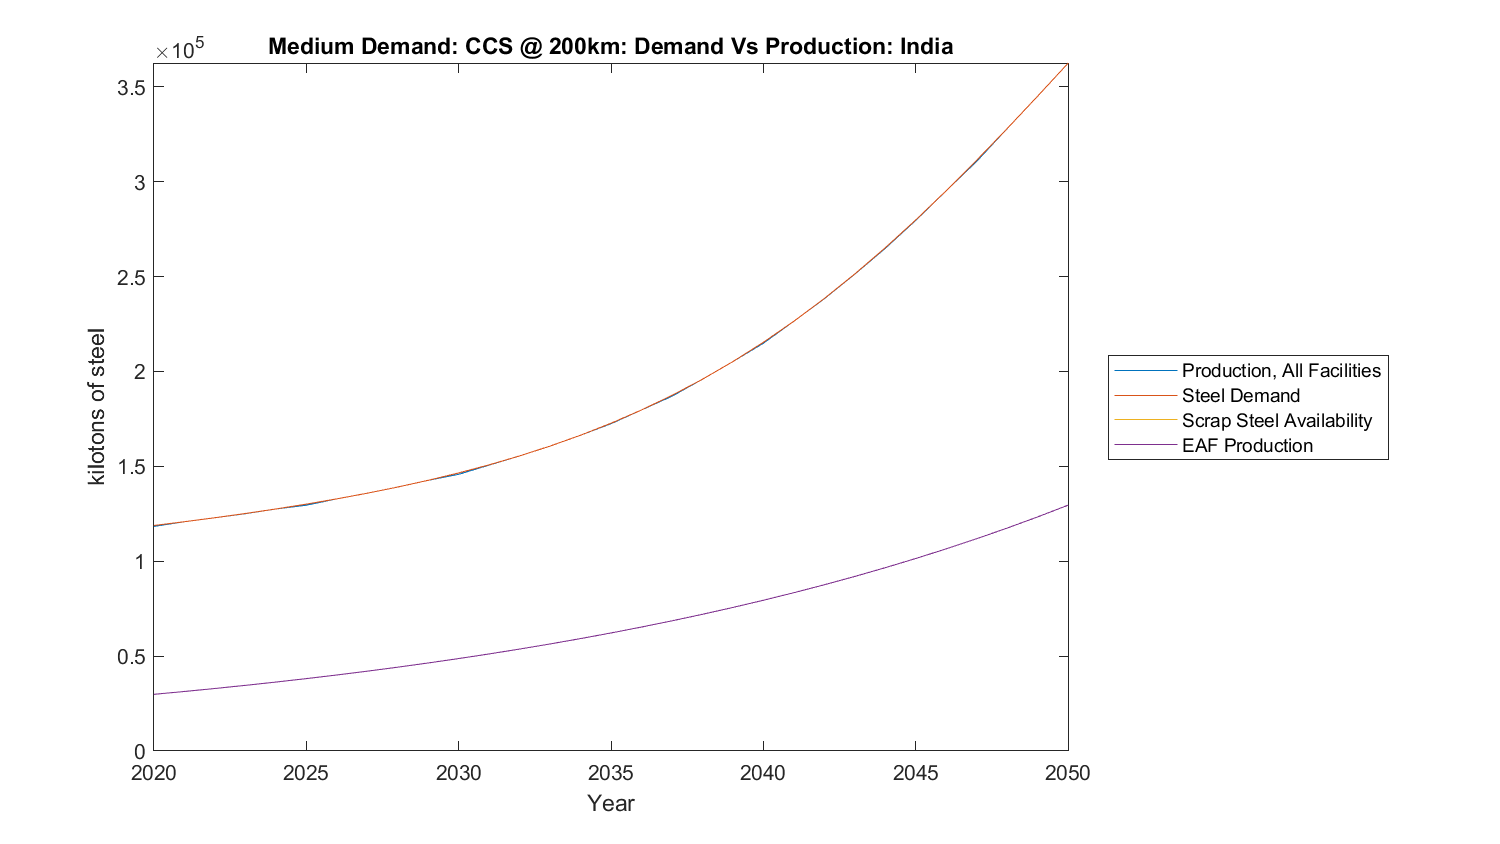
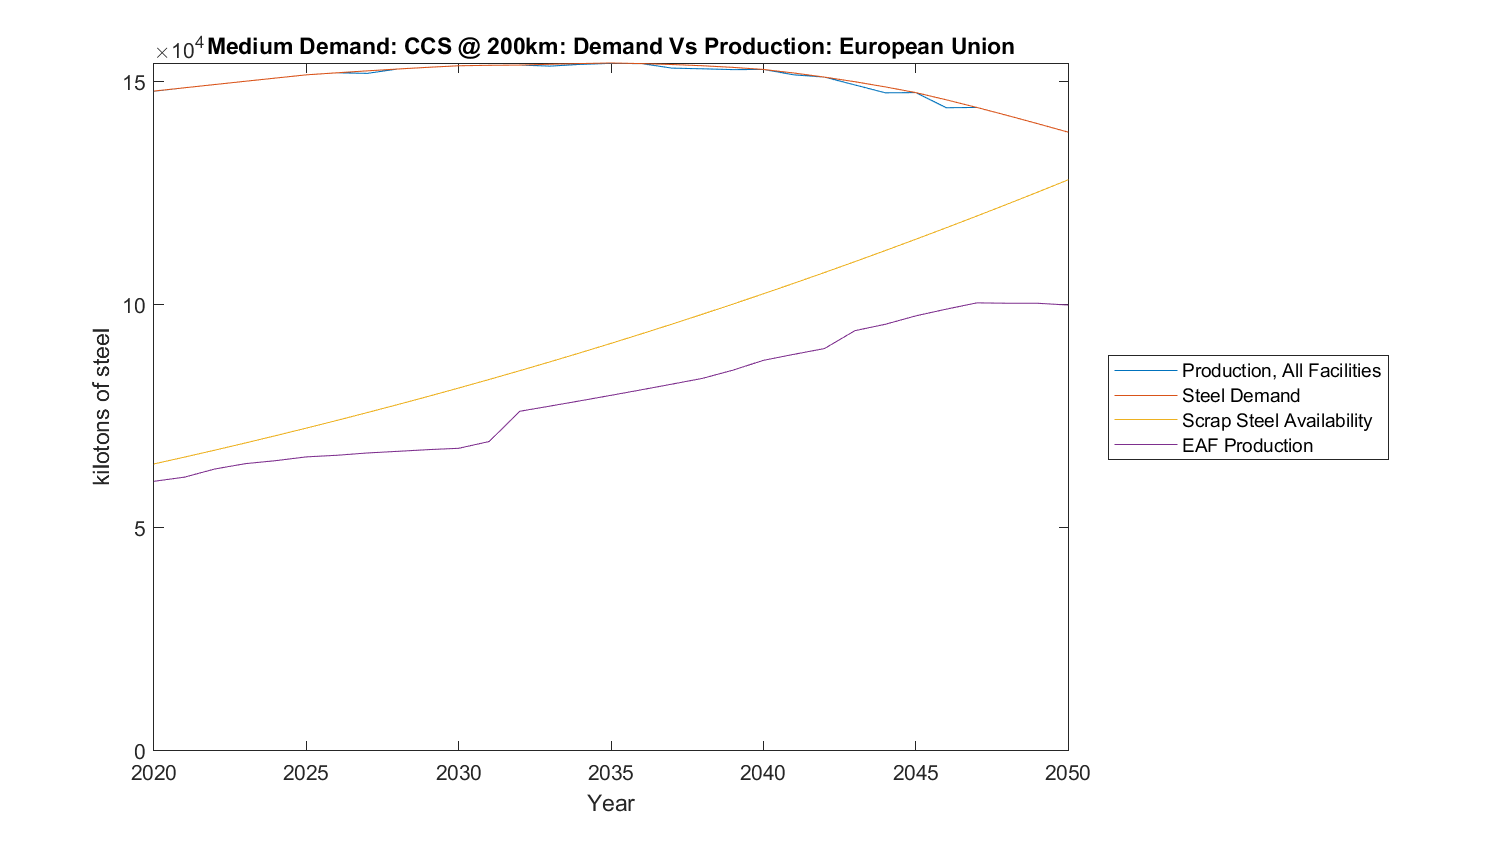
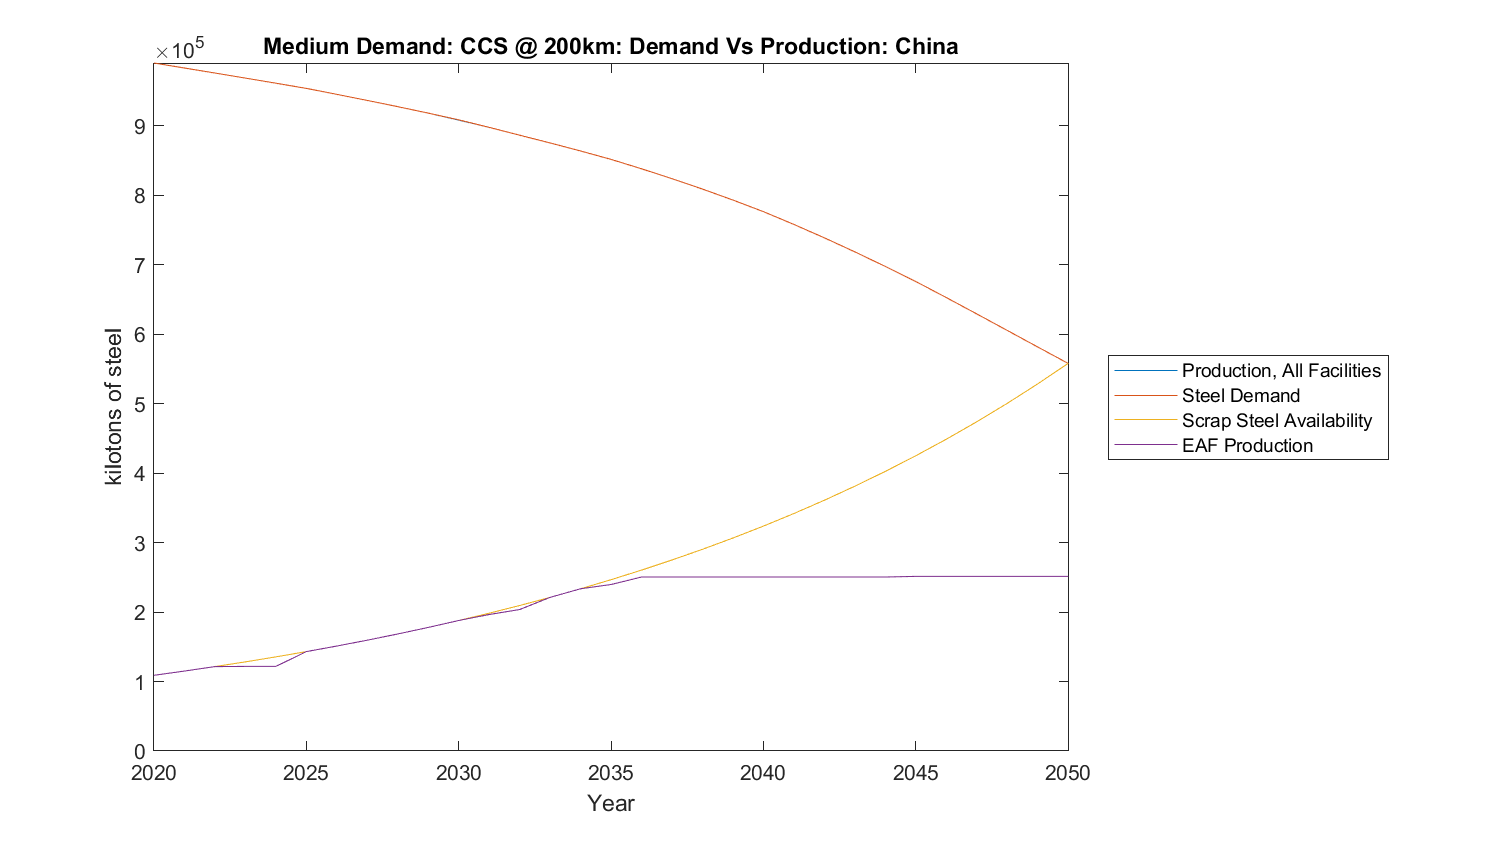
The global pathway below, represented as a spatial animation (showing the location of production) and a bar chart (showing a global summary of production over time), represents the “middle” scenario in our matrix of nine (global demand evolving to 200, 250, and 300 kg per capita (it’s 222 today), and access to 100, 200 and 300 km of CO2 transport to geological disposal. A 25-year furnace relining schedule was assumed. Recycled steel making, which normally occurs in electric arc furnaces but can supplement BF-BOFs by 30%, roughly triples from 2020 through 2050. DRI steel making, both with CCS and green hydrogen start replacing all new primary in the late 2020s, and with BF-BOFs with CCS eventually taking about 10% of the market. You’ll notice a topmost blue layer, and that is about 200 Mt/yr of green steel demand that cannot be met from existing sites (“Non spatially allocated production”), and new sites need to be built where the resources, economics, and politics best align, and could be domestic or foreign to the demand.
The global geospatial transformation for medium demand with 200 km of CO2 transport/pipeline access
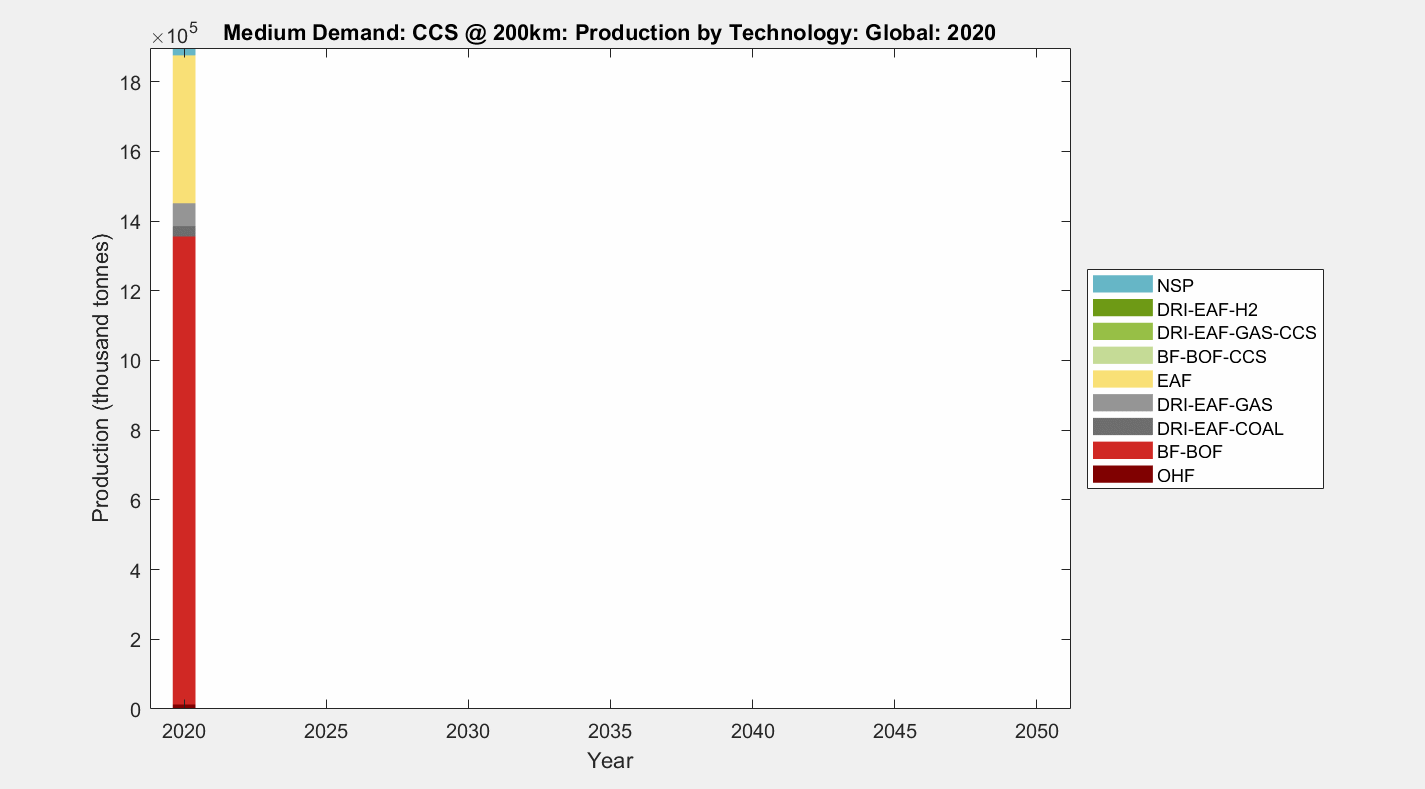
Global production and technology for medium demand with 200 km of CO2 transport/pipeline access
BF-BOF | Blast Furnaces for sintering iron ore / Basic Oxygen Furnaces for smelting |
DRI-EAF GAS | Direct Reduced Iron / Electric Arc Furnaces for smelting (coal) |
DRI-EAF COAL | Direct Reduced Iron / Electric Arc Furnaces for smelting (gas) |
OHF | Open-hearth furnace |
EAF | Electric Arc Furnaces |
BF-BOF-CCS (90%) | Blast Furnaces / Basic Oxygen Furnaces with 90% Post-combustion CCS |
DRI-EAF-GAS-CCS | Syngas direct reduced iron DRI with CCS followed by EAF |
DRI-EAF-H2 | Green hydrogen (electrolysis with clean electricity) DRI followed by EAF |
NSP | Non spatially allocated production |